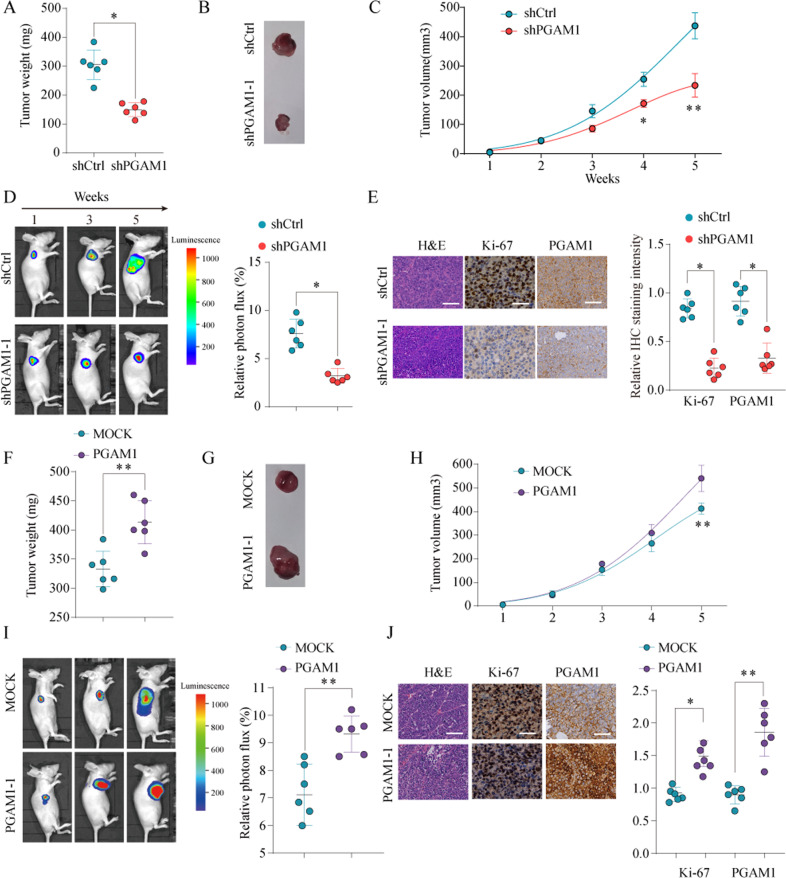
Fig. 4. PGAM1 promotes the proliferation of NSCLC cells in vivo.
A549 cells infected by lentiviral to achieve PGAM1 stable knockdown (sh-PGAM1) or PGAM1 overexpression (PGAM1) or infected by negative control (shCtrl or MOCK, respectively) were implanted into the nude mice and tumor growth was recorded. Tumor weight in nude mice was assessed at week 5 (a, b) and tumor volume (c) was determined based on tumor size measured every week in nude mice from shCtrl or shPGAM1 group. Representative bioluminescent images and quantification of bioluminescent imaging signal intensities in nude mice from shCtrl or shPGAM1 group (d). Representative images of HE staining, Ki-67 and PGAM1 IHC staining of tumor tissues obtained from nude mice from shCtrl or shPGAM1 group. Scale bar = 100 μm (e). Tumor weight in nude mice was assessed at week 5 (f, g) and tumor volume (h) was determined based on tumor size measured every week in nude mice from MOCK or PGAM1 group. Representative bioluminescent images and quantification of bioluminescent imaging signal intensities in nude mice from MOCK or PGAM1 group (i). Representative images of HE staining, Ki-67 and PGAM1 IHC staining of tumor tissues obtained from nude mice from MOCK or PGAM1 group. Scale bar = 100 μm (j). The results are presented as the mean ± SD for each group (n = 6). *p < 0.05, **p < 0.01 by Mann–Whitney U-test.

