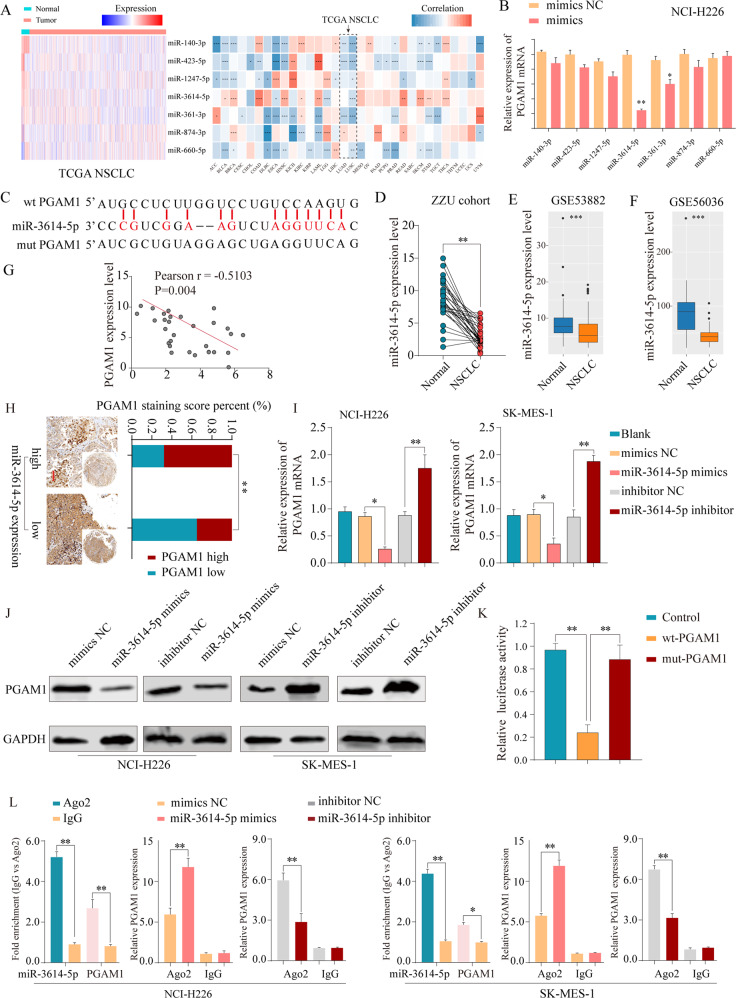
Fig. 6. PGAM1 expression is downregulated by miR-3614-5p directly targeting of the 3’-UTR of PGAM1.
a The expression status of candidate miRNAs targeting PGAM1 were analyzed based on TCGA dataset (left panel). Pearson analysis of the correlation between PGAM1 and candidate miRNAs based on TCGA database (right panel). b Expression of PGAM1 was detected under treatment of candidate miRNA mimics in NCI-H226 cells. c PGAM1 was found for the potential regulatory targets of miR-3614-5p using prediction tool (Starbase 3.0). The PGAM1 mRNA levels were determined by real-time PCR analysis in 30 paired NSCLC tissues (d), and in GSE53882 (e) and GSE56036 (f) datasets. g Pearson analysis of the correlation between PGAM1 and miR-3614-5p expression in 30 paired NSCLC specimens. h Representative IHC staining of PGAM1 and miR-3614-5p in NSCLC tissues (left panel) and quantification of PGAM1 staining scores in NSCLC patients from ZZU cohort with high or low miR-3614-5p expression (right panel). Scale bars, 100μm. The PGAM1 expression levels were determined by real-time PCR analysis (i) western blot (j) after transfection with the miR-3614-5p mimics or negative control or after transfection with the miR-3614-5p inhibitor or negative control in NCI-H226 and SK-MES-1 cells. GAPDH served as an internal control. k Luciferase activity assays for luciferase reporters with wild-type or mutant PGAM1 3’-UTR were performed after co-transfected with miR-3614-5p mimics or miR-control in 293 T cells. The luciferase activity of each sample was normalized to Renilla luciferase activity. l RIP assays confirmed the binding status between miR-3614-5p and PGAM1 in untreated and treated NSCLC cell lines, respectively. The representative result of at least three independent experiments was shown. *p < 0.05; **p < 0.01.

