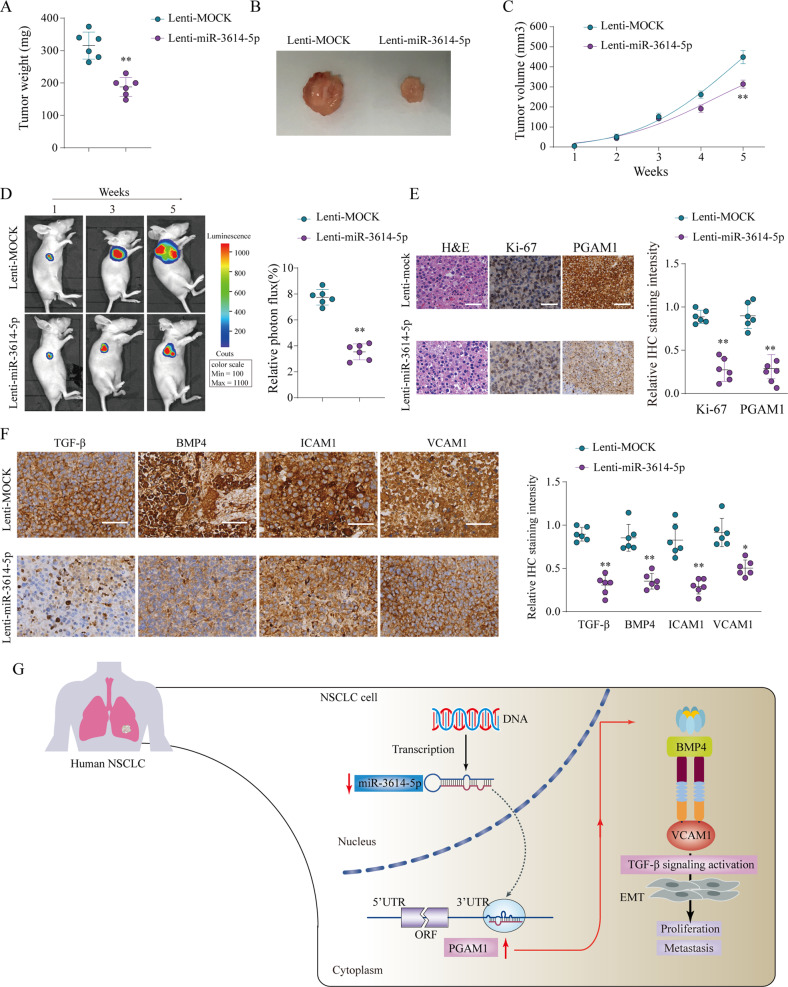
Fig. 8. MiR-3614-5p suppress the proliferation of NSCLC cells in vivo.
A549 cells infected by lentiviral to achieve miR-3614-5p stable overexpression (Lenti-miR-3614-5p) or infected by negative control (Lenti-MOCK) were implanted into the nude mice and tumor growth was recorded. Tumor weight in nude mice was assessed at week 5 (a, b) and tumor volume (c) was determined based on tumor size measured every week in nude mice from Lenti-miR-3614-5p or Lenti-MOCK group. Representative bioluminescent images and quantification of bioluminescent imaging signal intensities in nude mice from Lenti-miR-3614-5p or Lenti-MOCK group (d). Representative images of HE staining, Ki-67 and PGAM1 IHC staining of tumor tissues obtained from nude mice from Lenti-miR-3614-5p or Lenti-MOCK group. Scale bar = 100 μm (e). Expression levels of TGF-β, BMP4, ICAM1 and VCAM1 in A549 cells transfected with Lenti-miR-3614-5p or Lenti-MOCK were analyzed by IHC staining (f). A proposed regulated axis between miR-3614-5p/PGAM1 axis driving TGF-β-induced EMT in NSCLC progression (g). The results are presented as the mean ± SD for each group (n = 6). *p < 0.05, **p < 0.01 by Mann–Whitney U-test.

