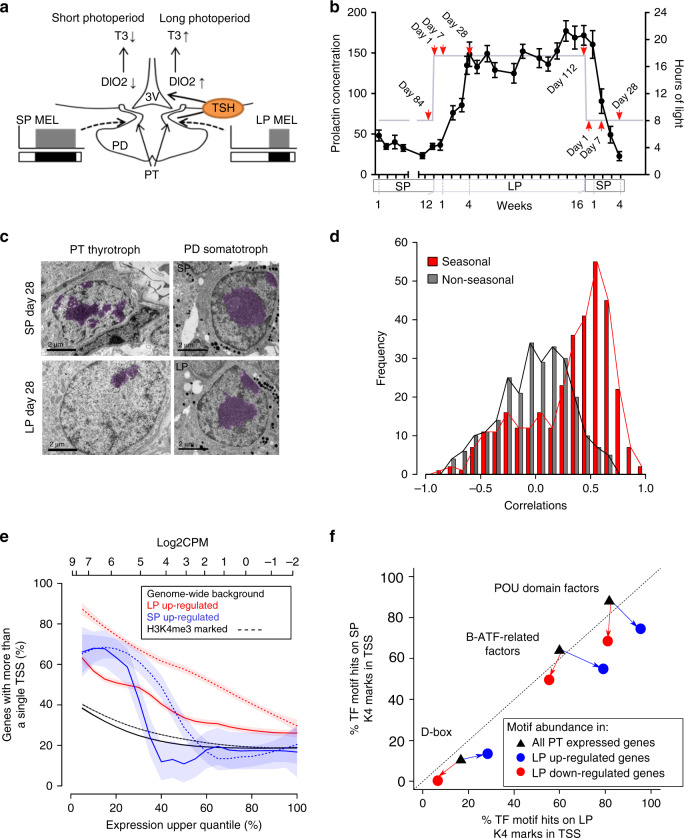
Fig. 1. Photoperiod dependent epigenetic regulation of transcription in the Pars tuberalis.
a Current model for the mammalian photoperiodic circuitry. b Prolactin concentrations during the experiment (black), n = 28 biologically independent animals per time-point. Error bars represent the SEM. Gray line: number of hours of light the animals received in 24 hours. Red arrows show terminal sampling points (ZT4), with the exception of day 28 where animals were collected across the day at 4 hour intervals. c EM images of Pars tuberalis (PT) thyrotrophs and Pars distalis (PD) somatotrophs at LP day 28 and SP day 28. Dense chromatin in the nucleus is false colored in purple. Black scale bars = 2 μm. d Histogram revealing frequency distributions of Pearson correlation coefficients between RNA expression (log2 CPM) and H3K4me3 peak read counts ±200 bp from TSSs (log2 read counts). Red bars are seasonally expressed genes (log2 fold change ≥1 or ≤−1 and adjusted p-value <0.05 of short photoperiod (SP) day 84 vs long photoperiod (LP) day 1, 7, 28 and LP day 112 vs SP day 1, 7, 28 differentially expressed genes (DEGs) = 480) and black bars are non-seasonally expressed genes (log2 fold change ≤0.1 and ≥−0.1 from the same comparisons, (genes = 218)). e Prevalence of multiple (>1) TSSs in LP day 28 up-regulated DEGs (solid red), SP day 28 up-regulated DEGs (solid blue) and all PT expressed genes as the background (solid black) as a percentage of the uppermost expressed genes (i.e., increasing thresholds for the upper quantile of gene expression). Log2CPM values for upper quantiles on upper x-axis. Dashed lines indicate the proportion of gene in the cohorts with multiple H3K4me3 (>1) marked TSS. f Over-represented motifs LP day 28 up and down-regulated genes, compared to SP day 28. The percentage of H3K4me3 marked TSS (±100 bp) containing a specific motif is given. The black triangles represents the motif abundance in all the genes expressed (>0 CPM) in the PT and the percentage of marked with H3K4me3 in LP (x-axis) or SP (y-axis). The circles show the motif abundance and percentage H3K4me3 marked TSSs in LP up-regulated (blue) and down-regulated (red) genes (FDR <0.05; fishers two-way exact test).

