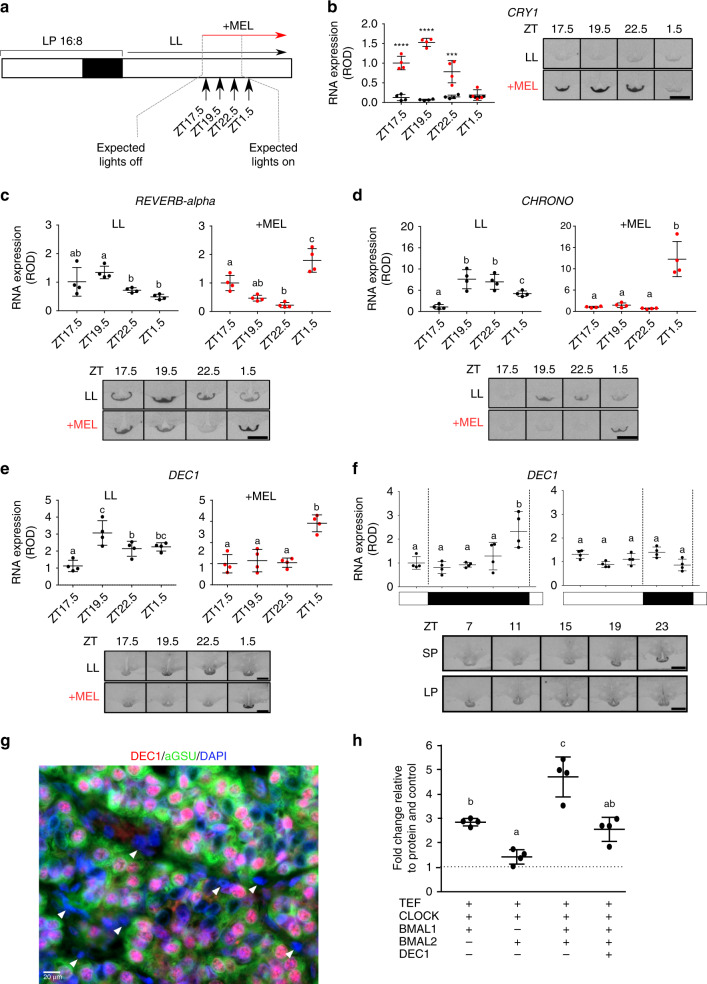
Fig. 5. Melatonin duration defines the expression of repressor genes.
a Study design. Animals were sampled at 1.5 hour intervals with either a sham implant or melatonin implant. LL = constant light. b In-situ hybridization and quantification for CRY1 mRNA. Red bars are the value in the presence of melatonin, black bars are in constant light with a sham implant (n = 4). Representative images are shown. Statistical significances from a one-way ANOVA and are between the melatonin and sham implant at each time-point. Error bars represent the SD. p-value; *<0.01, **<0.001, ***<0.0001, ****<0.00001. c In-situ hybridization and quantification for REVERb-alpha mRNA. Red bars are the value in the presence of melatonin, black bars are in constant light with a sham implant (n = 4). Representative images are shown. Statistical analysis by one-way ANOVA performed, different letters indicate significant differences between groups (p < 0.01). Error bars represent the SD. d As in c for CHRONO mRNA. e As in c for DEC1 mRNA. f In-situ hybridization and quantification for DEC1 mRNA from archived material from collected every 4 hours from SP and LP (n = 4). Representative images are shown. Error bars represent the SD. Statistical analysis by one-way ANOVA performed, different letters indicate significant differences between groups (p < 0.01). g Double immunohistochemistry for DEC1 (red), α-GSU (green) and dapi nuclear stain (blue). White arrow heads indicate FS cells. Scale bar 20 μm. h Transactivation of the EYA3-downstream-TSS-luc reporter by TEF, CLOCK, BMAL1 and BMAL2 is repressed by DEC1. The experiment was repeated 4 times (n = 4 per experiment), plot displayed is a representative result. A one-way ANOVA was performed on each individual experiment using Tukey’s multiple comparisons test. Different letters indicate significant differences between groups (p < 0.01). Error bars SD.

