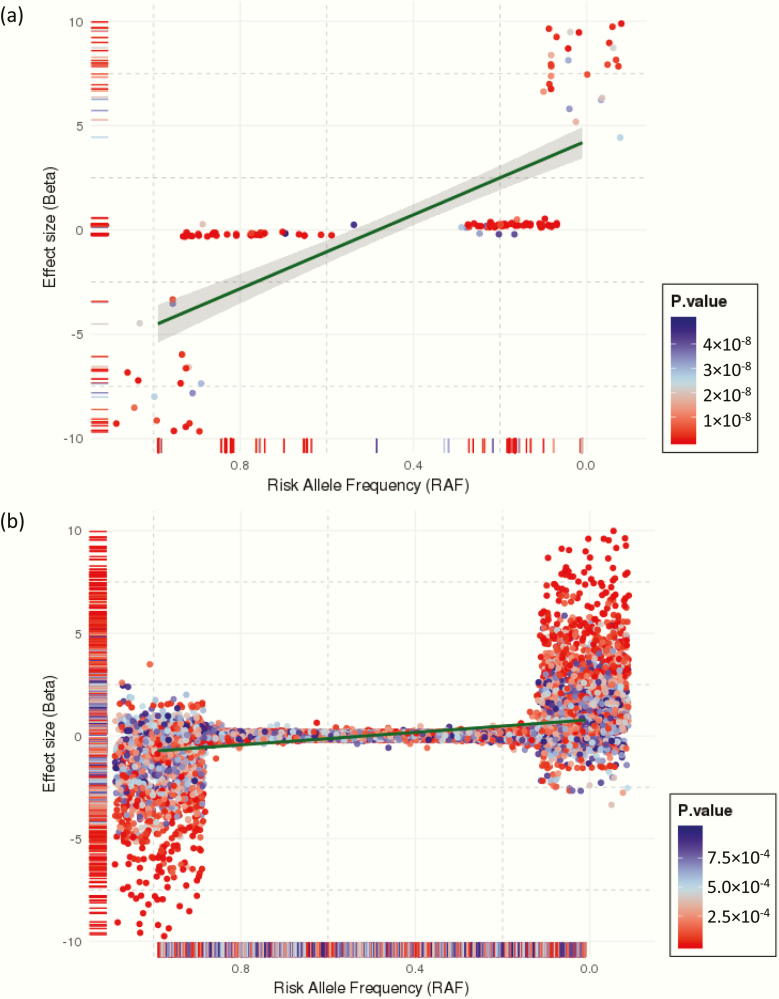
Figure 1.
Effect distribution of PCOS susceptibility variants in samples from the International PCOS consortium by risk allele frequency. (A) The 139 PCOS genome-wide significant SNVs (P < 5 × 10⁻⁸), and (B) the 120 340 PCOS autosomal SNVs with P < 0.05. The dark green line and grey band around it are the linear regression fit and its 95% confidence interval, respectively, between risk allele frequency and effect size (beta).

