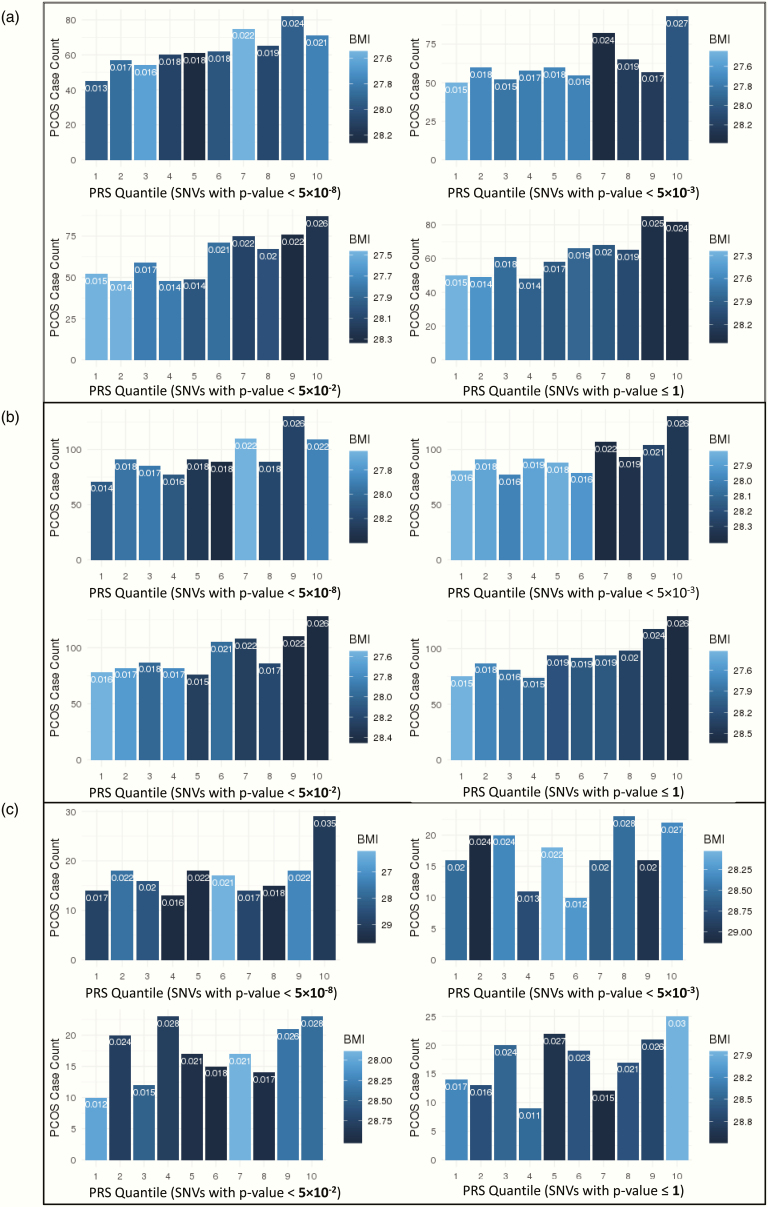
Figure 2.
Stratification performance by quantile of PRS models, including PCs 1–4 and site as covariates, in (A) EA, (B) MA, and (C) AA populations. Group 1 includes those with the lowest PRS, and group 10 includes those with the highest. Bar colors indicate the average BMI in the quantile (darker indicates higher BMI), while the proportion of PCOS-diagnosed patients in each group is indicated at the top of each bar.

