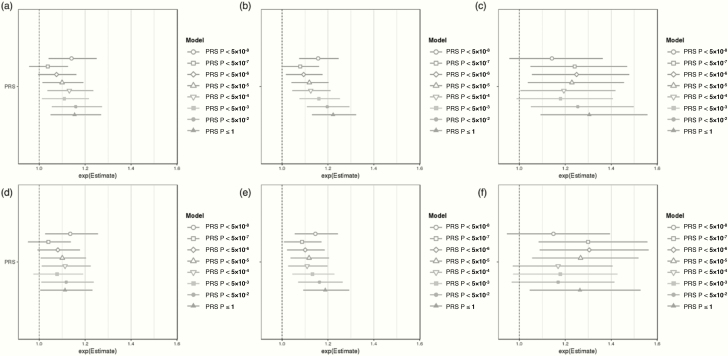
Figure 3.
Comparison of odds ratios (ORs) for the PRS and PPRS in (A/D) EA, (B/E) MA, and (C/F) AA cohorts, at different PRS/PPRS inclusion thresholds by GWAS P-value. The top row shows OR distributions for the PRS model, which adjusted for basic covariates (PRS model = PCOS ~ PRS + PC1–4 + site). The bottom row shows OR distributions for the PPRS model which adjusted for the same basic covariates as well as PCOS EHR component phenotypes (PPRS model = PCOS ~ PRS + PC1-4 + site + hirsutism + female infertility + irregular menses).

