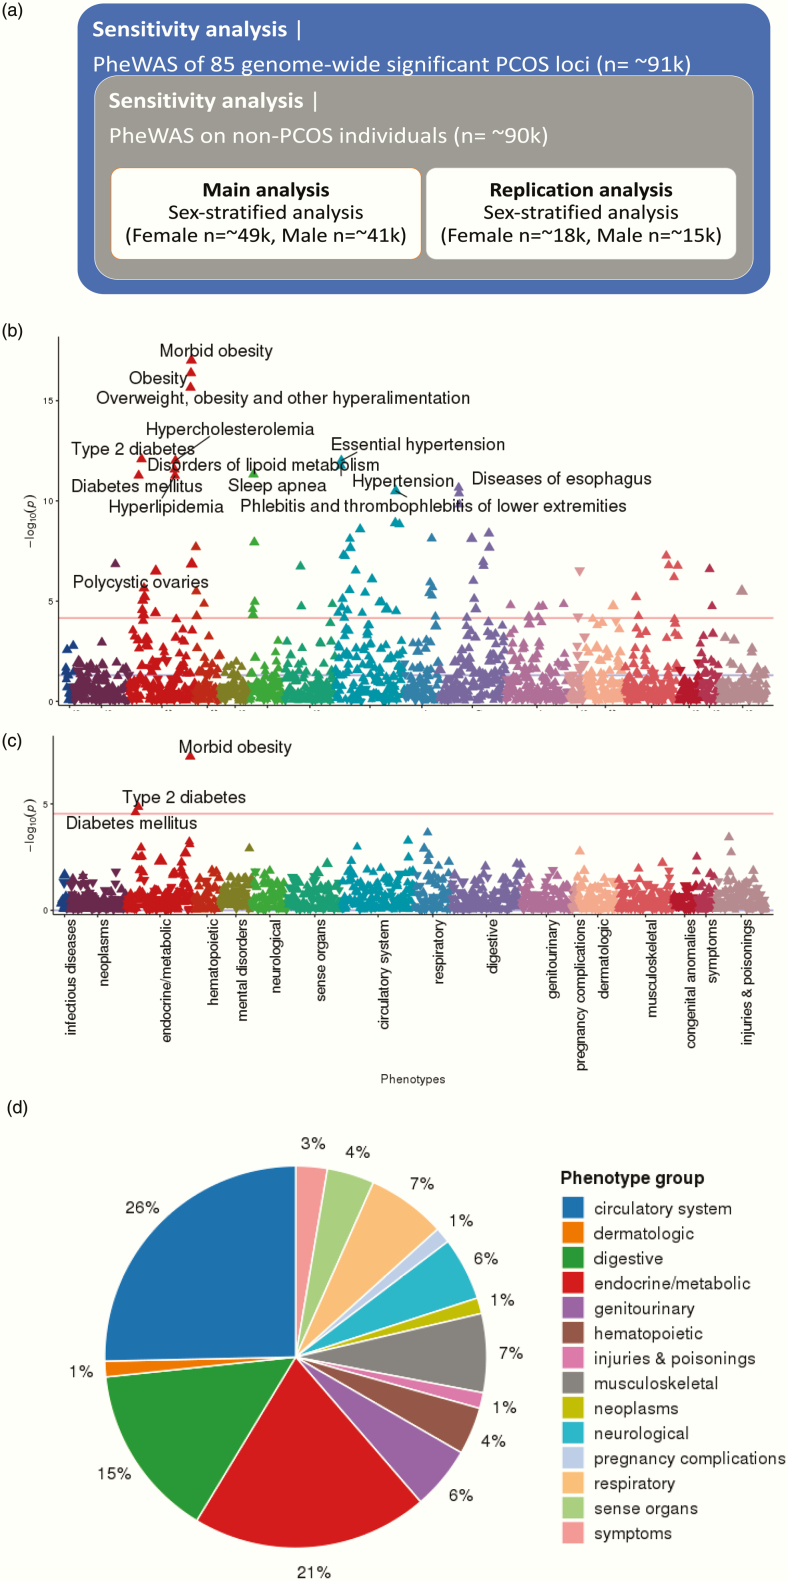
Figure 5.
PheWAS scheme and results using PRS. (A) PheWAS scheme and sample sizes; (B) PheWAS Manhattan plot of PRS (SNVs with P ≤ 1) in the phenomes of 49 343 female participants; (C) PheWAS Manhattan plot of PRS (SNVs with P ≤ 1) in the phenomes of 41 669 male participants; (D) pie chart summarizing PheWAS groups. In Manhattan plots (B) and (B), the x-axis represents the EHR phenotype categorical group and the y-axis represents the negative log(10) of the PheWAS P-value. Red lines indicate the cut-off for phenome-wide significance. For readability, only the most significant associations are annotated. Full lists of phenome-wide significant results are provided in refs (51,52). The pie chart in (D) shows EHR categories for the 72 phenome-wide significant phenotypes identified through PheWAS of the genome-wide PRS (SNVs with P ≤ 1).

