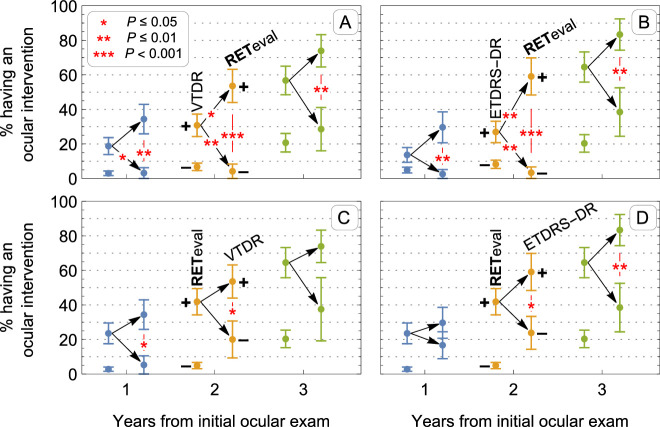
Figure 5.
The impact on probability of intervention after 1, 2, and 3 years of adding functional information to structural information (top row) or vice-versa (bottom row). For each year, the mean (± standard error of mean) of having a positive or negative measurement is shown for a first test. For positive first test results, the impact of adding a second test is shown. Stars represent statistically significant mean differences (without adjustment for multiple comparisons) for adding a second positive test, adding a second negative test, and between the second positive and negative tests. (A) The effect of RETeval result on prognosis in patients with VTDR+. (B) The effect of RETeval result on prognosis in patients with ETDRS-DR+. (C) The effect of VTDR result on prognosis in patients with RETeval+. (D) The effect of ETDRS result on prognosis in patients with RETeval+.

