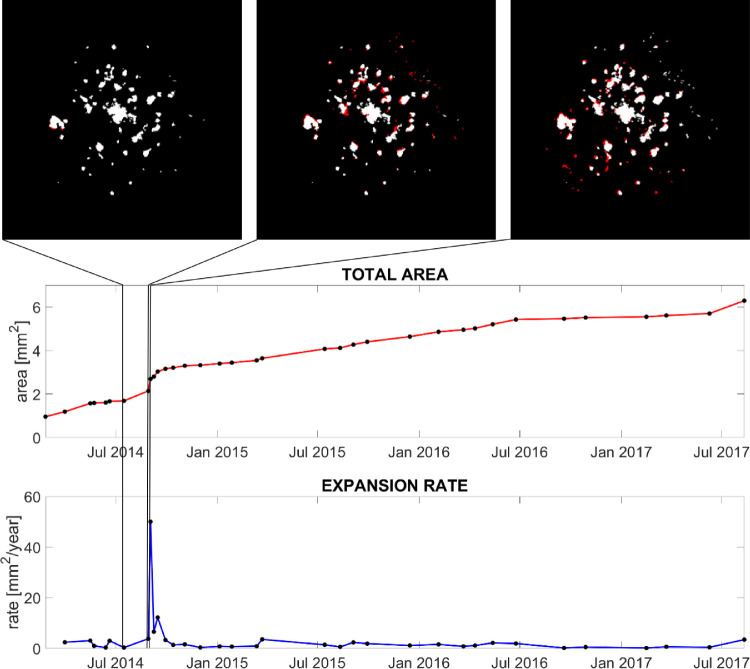
Figure 3.
Case study of chorioretinal lesions development in the left eye of a young woman with PIC. The red line shows the total area of PIC atrophic lesions measured from the segmentation of the time series. The blue line shows the first derivative of the total area, or expansion rate. The three images on top of the plots show the segmentation of three acquisitions taken just before the peak in the expansion rate. Black represents nonlesions; white represents lesions already segmented in the previous visit; red highlights newly segmented lesions.

