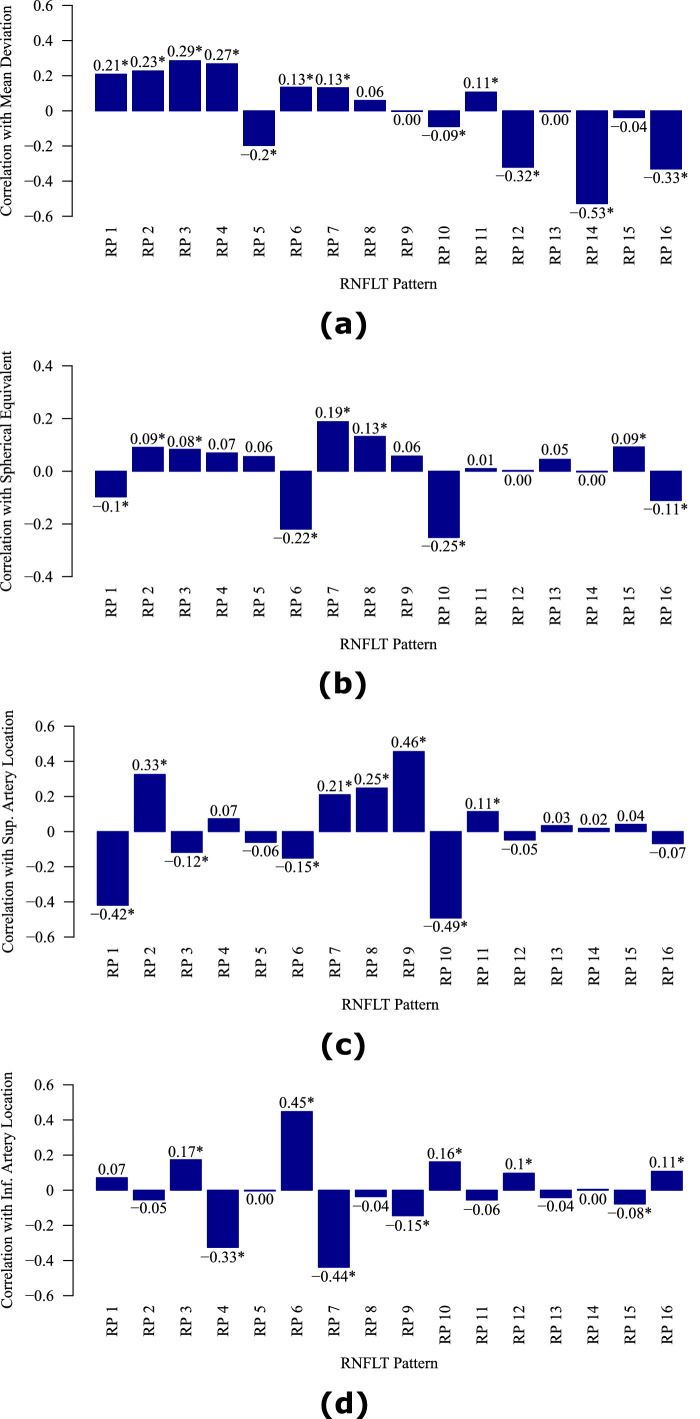
Figure 3.
The correlations between the decomposition coefficients of RNFLT patterns and the (a) mean deviation, (b) spherical equivalent, (c) superior artery location on the circle of 3.46 mm diameter, and (d) inferior artery location on the circle of 3.46 mm diameter. RP = retinal nerve fiber layer thickness pattern. *Denotes significant (P < 0.05) correlations.

