Fig. 5.
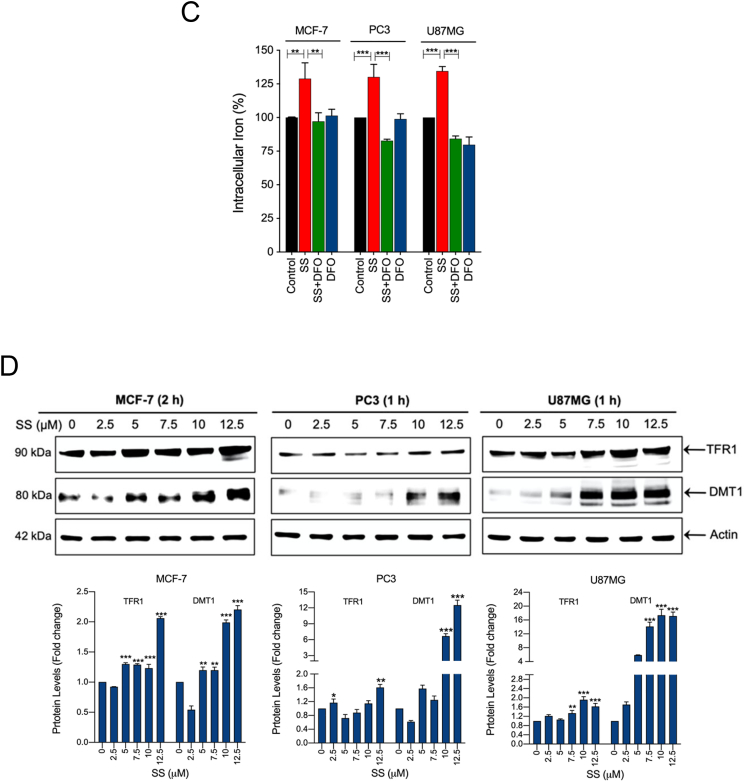
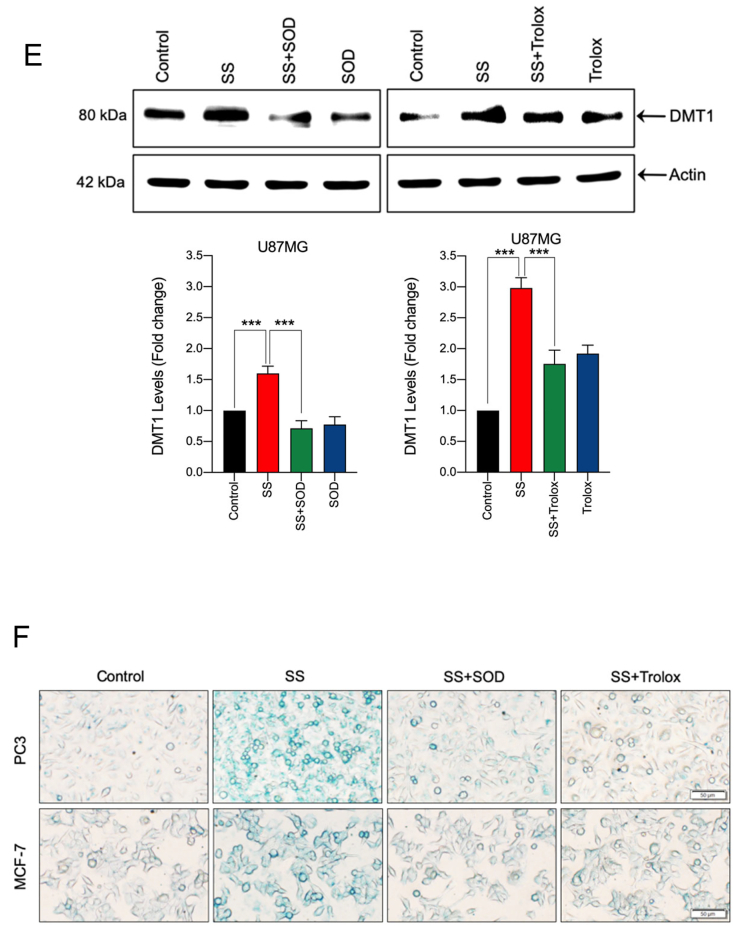
SS induces iron accumulation via the O2•−-dependent process. Cells pre-treated with DFO (50 μM) were treated with SS (10 μM). Following the treatment, cells were analyzed for (A) ROS generation. Data shown are means ± SD (n = 3) (**p < 0.01 and ***p < 0.001), and (B) production of O2•−. Scale bar, 50 μm (upper panel). The DHE-derived fluorescence intensity was further quantified by fluorometry analysis (bottom panel). Data shown are means ± SD (n = 3) (*p < 0.05, and **p < 0.01). (C) Cells were pre-treated with DFO (50 μM) for 1 h followed by SS (10 μM) treatment for further 1 h and intracellular iron levels were measured. Data shown are means ± SD (n = 3) (**p < 0.01 and ***p < 0.001). (D) Cells were treated with the indicated concentration of SS for the indicated time period. Western blot analysis of TFR1 and DMT1 was carried out. Actin was used as a loading control. Signal intensity of protein bands were normalized to actin of each group, and fold changes were presented in histogram from three independent experiments (n = 3). (*p < 0.05, **p < 0.01 and ***p < 0.001 vs respective control). Cells were pre-treated with SOD (500 U/mL) and Trolox (1 mM) for 1 h followed by SS (10 μM) treatment for 3 h. Following the treatment, (E) western blot analysis of DMT1 was detected. Actin was used as a loading control. Signal intensity of protein bands were normalized to actin of each group, and fold changes were presented in histogram from three independent experiments (n = 3). (***p < 0.001), and (F) intracellular iron distribution was performed by Prussian blue cellular staining as described under Materials and methods. The stained cells were then examined under an inverted bright field microscope. Scale bar, 50 μm.


