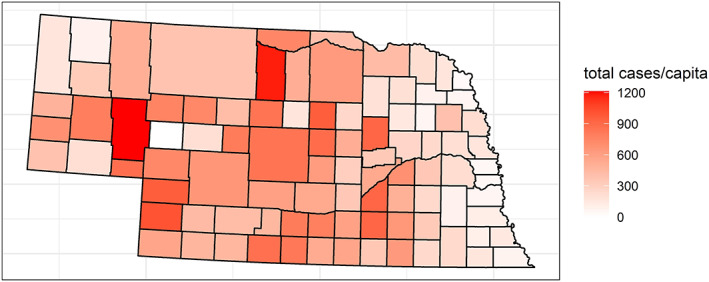
Figure 2.

Cumulative incidence of human cases of WNV through 2018. This map of cumulative incidence shows that counties in eastern Nebraska have generally had a lower infection rate. Cumulative incidence is all cases over time, both neuro‐ and non‐neuroinvasive, per 100,000 population.
