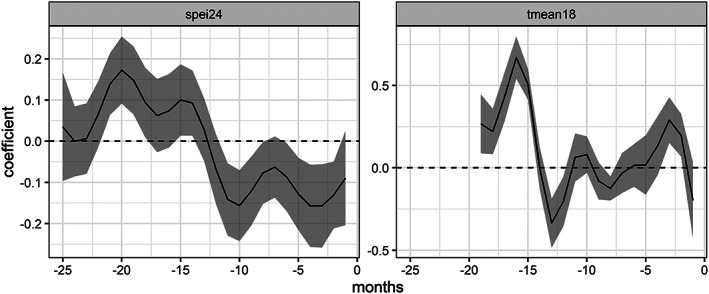
Figure 3.

Lagged coefficients for SPEI and mean temperature, model trained on data 2002–2012. The fitted model produced coefficients for each month that showed the influence of drought and temperature variables through February of the year being predicted. Each 1‐unit change in SPEI or mean temperature multiplied by the coefficient, added for each of the months, increased or decreased our response variable, the log of human cases per 100,000 people. A general theme pattern that emerged from many models was that warm temperatures and a dry year preceded by a wet year produced more human cases.
