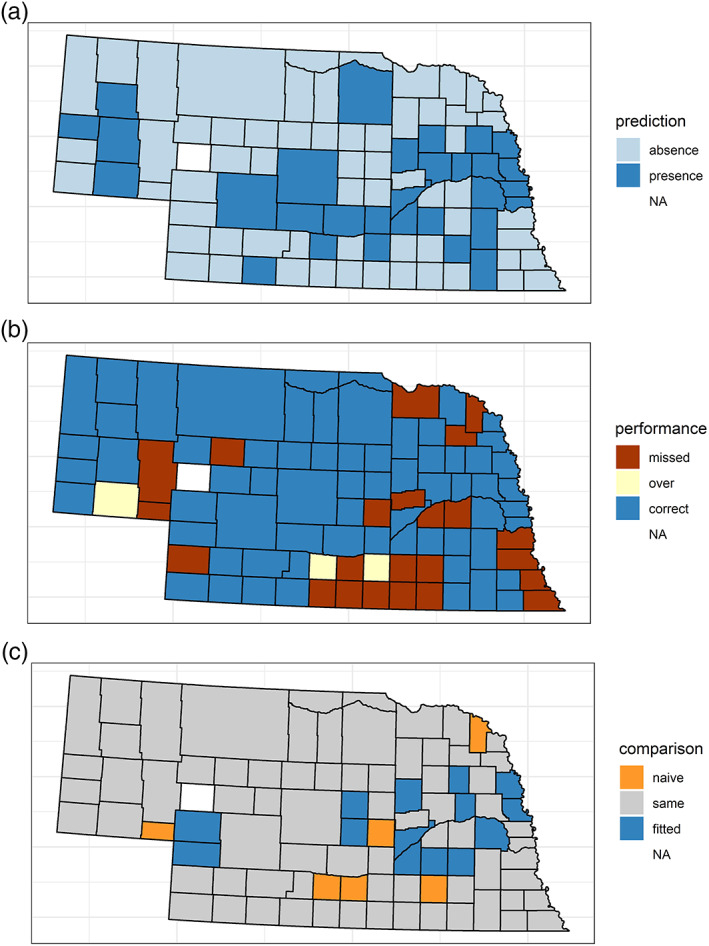
Figure 4.

The 2018 presence/absence predictions, performance of predictions, comparison with naïve. (a) Counties predicted to have cases in 2018. “Absence” means counties were predicted to have no cases. “Presence” means they were predicted to have at least one case. Arthur County, white, is “NA” because it has never had any cases and was excluded as an outlier. (b) County prediction performance in 2018. “Missed” means one or more cases occurred in a county not predicted to have cases. “Over” means one or more cases were predicted but did not occur. “Correct” means that a prediction for either the presence or absence of cases was correct. (c) Performance of fitted vs. naïve model in predicting counties with cases. Counties in orange are ones that the naïve model got right but the fitted model did not. Counties in blue are ones that the fitted model got right and the naïve did not. The models performed the same, right or wrong, in counties that are gray.
