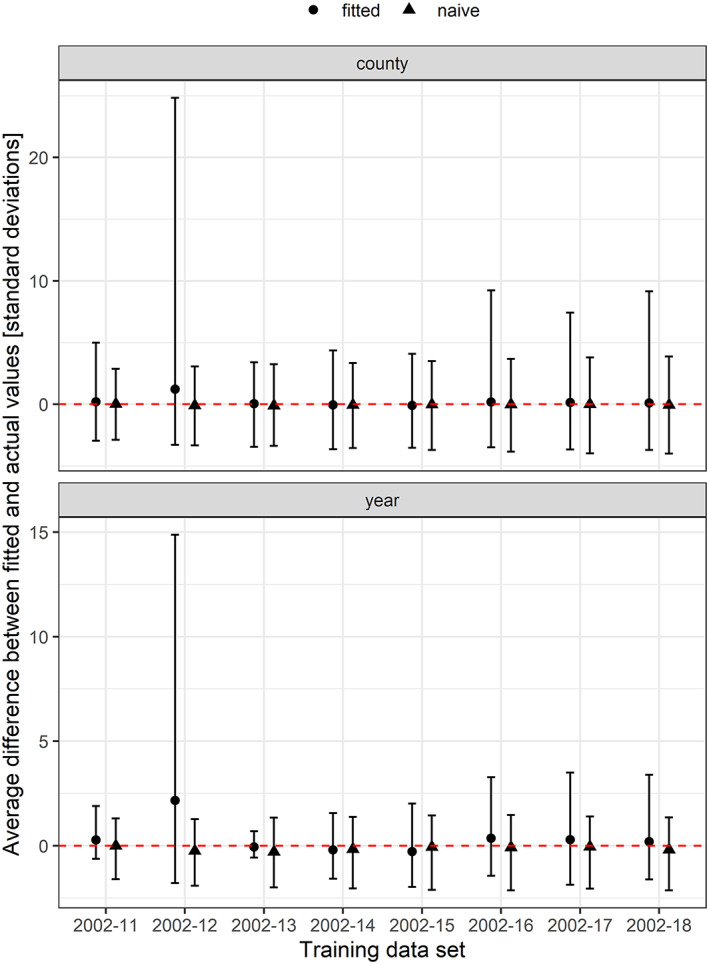
Figure 5.

Numeric prediction performance comparisons. This figure contrasts the performance of best fitted models for each set of training data with the performance of an annual persistence naïve model, comparing predictions with actual cases from 2005 on (to avoid handicapping the naïve). The difference between predicted and actual cases is grouped by year and by county and expressed as standard deviations, with an icon indicating the mean difference. Intervals show the minimum and maximum single year or county with the smallest or largest difference between predicted and observed cases.
