Figure 6.

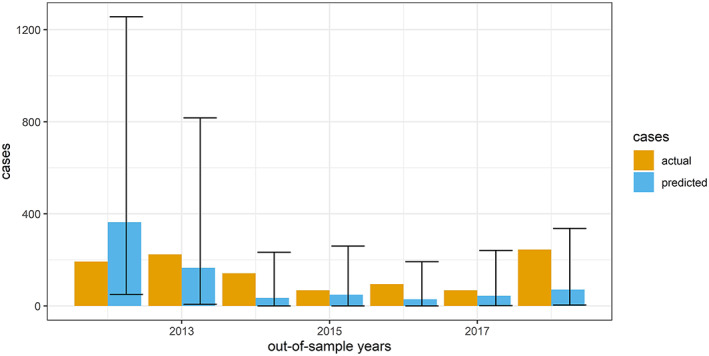
Predicted vs. observed cases, with prediction intervals, for out‐of‐sample years, 2012–2018. This chart compares actual and predicted numbers of cases, with actual numbers in tan, and predicted numbers in blue, with prediction intervals.

Predicted vs. observed cases, with prediction intervals, for out‐of‐sample years, 2012–2018. This chart compares actual and predicted numbers of cases, with actual numbers in tan, and predicted numbers in blue, with prediction intervals.