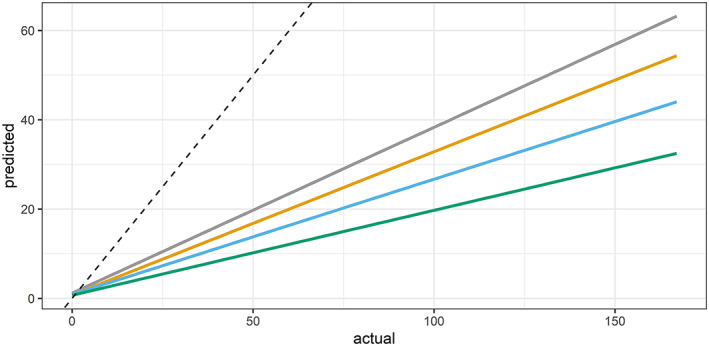
Figure 7.

Scenarios without drought, without warm temperature, and with neither. The gray line shows predictions of our fitted model, the baseline scenario. The orange line is the no‐drought scenario. The blue line is the no‐warm temperature scenario. The green line shows the scenario with neither drought nor warm temperatures. The dotted line is where a 1:1 predicted‐to‐actual relationship would be.
