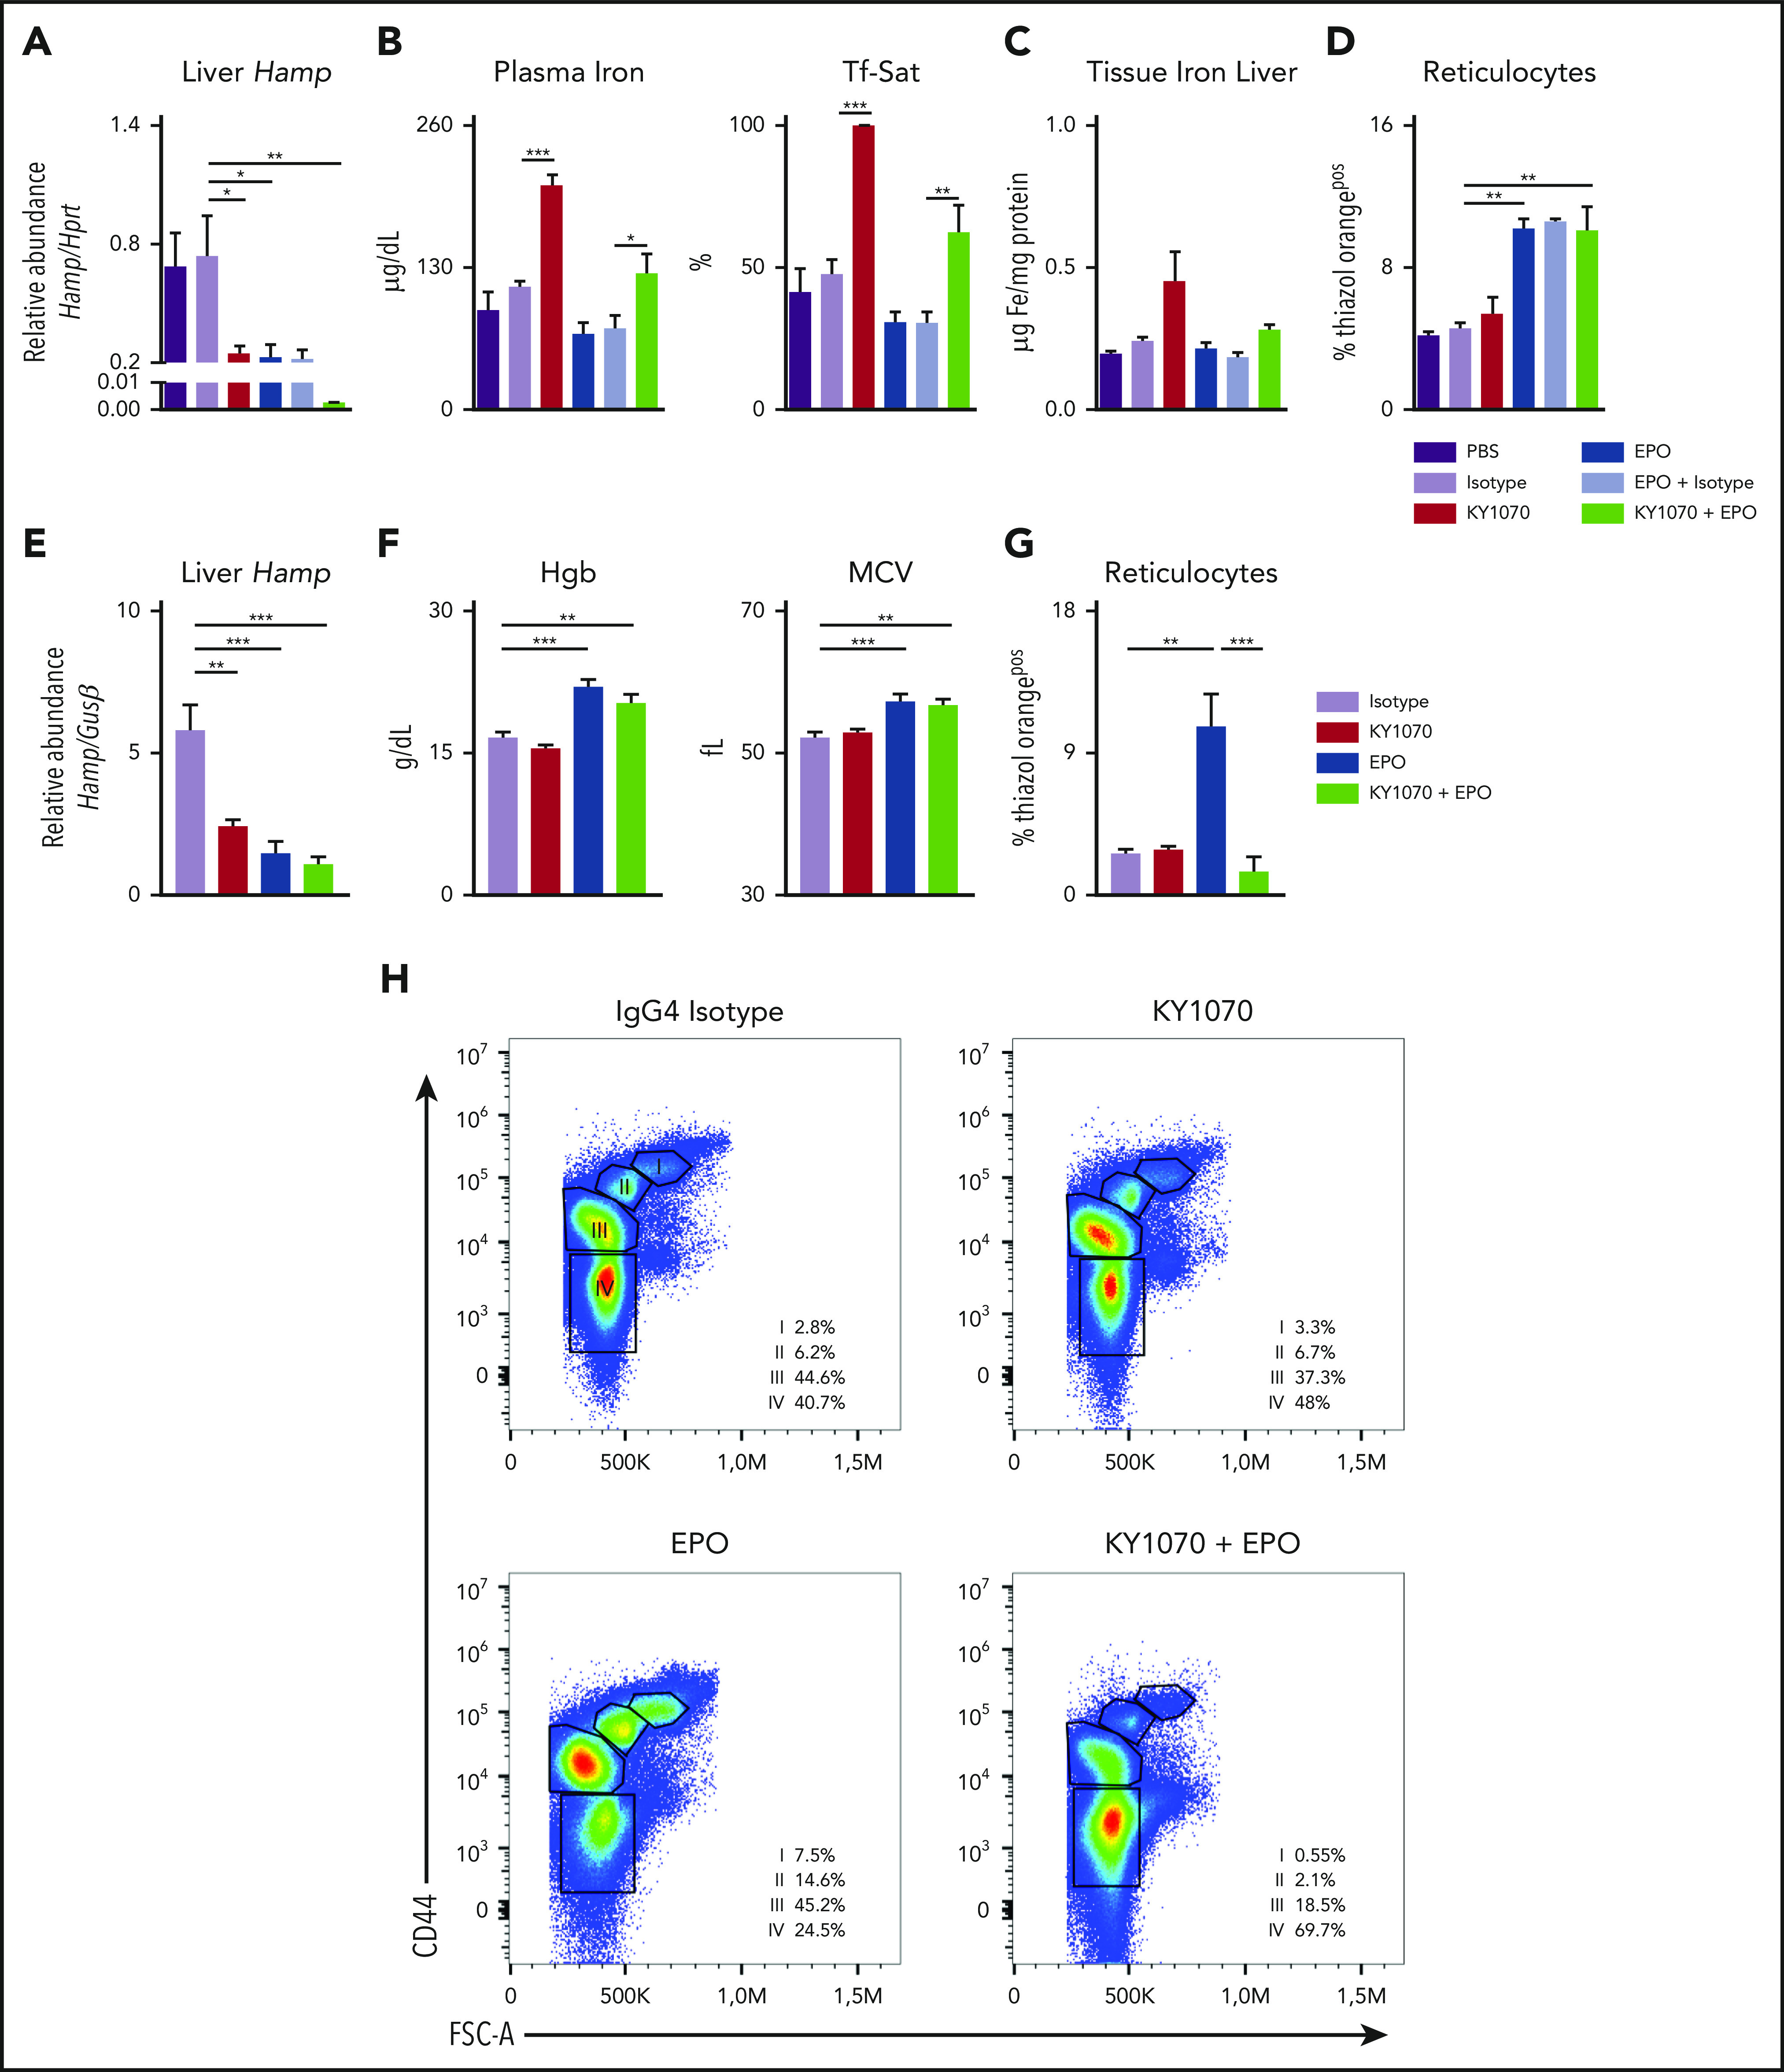
Figure 2.

KY1070 effectively suppresses hepcidin levels in healthy mice and rats and leads to an improved erythroid output in combination with Darbepoetin alfa over time. (A-D) Healthy C57BL/6N mice were treated with a single dose of either PBS (n = 5), IgG4 isotype control (3 mg/kg; n = 5), KY1070 (3 mg/kg; n = 5), Darbepoetin alfa (10 µg/kg; n = 5), Darbepoetin alfa and IgG4 isotype control (n = 5), or KY1070 and EPO (n = 5). Liver Hamp mRNA levels (A), plasma iron (B), Tf-Sat, hepatic tissue iron levels (C), and reticulocyte counts (D) (shown as %Thiazol Orangepos) were determined 3 days after indicated treatments. (E-G) Healthy Lewis rats were treated with IgG4 isotype control (3 mg/kg; n = 6), KY1070 (3 mg/kg; n = 7), Darbepoetin alfa (10 µg/kg; n = 7), or KY1070 and EPO (n = 7). Liver Hamp mRNA levels (E), hemoglobin levels (Hgb) (F), MCV, and hepatic tissue iron levels (C), and reticulocyte counts (G) (shown as %Thiazol Orangepos) were determined at day 21 after a single KY1070 treatment ± weekly EPO application. (H) Flow cytometric analysis of rat bone marrow erythropoiesis at the end of treatment in rats of all different treatment groups. Representative dot plots for Lineageneg cells with percentages of the different erythropoietic populations (I to IV) per femur are given; basophilic cells (I), polychromatic cells (II), orthochromatic cells and reticulocytes (III), and mature RBCs (IV); for gating strategy see supplemental Figure 3F. Two-way analysis of variance (ANOVA) with Tukey corrected post hoc Student t test for multiple comparisons between all groups was applied for panels A-G. Results are shown as means ± SEM. Significant levels are indicated for the Isotype-treated control group against all treatment groups and EPO vs KY1070 + EPO–treated rodents. *P < .05; **P < .01; ***P < .001. FSC-A, forward scatter area.
