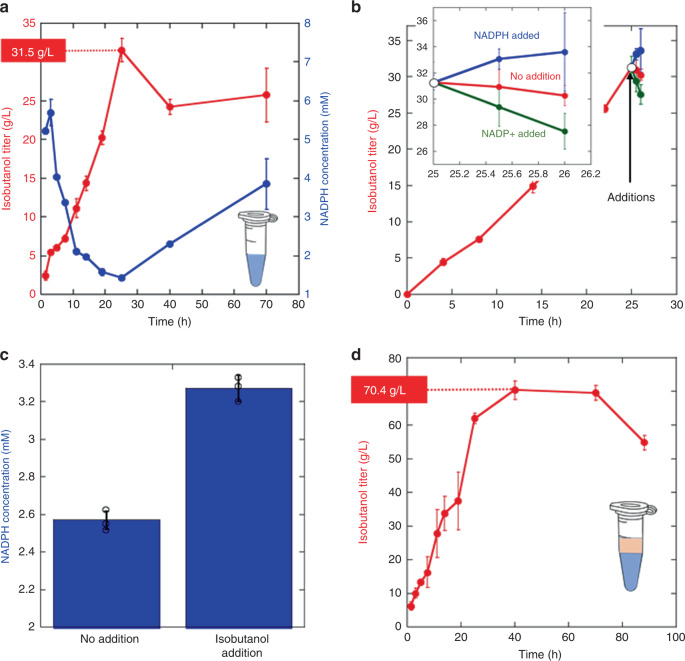
Fig. 3. Small scale reactions.
a Isobutanol and NADPH titers over time for 200 µL reactions. b Effect on isobutanol titers by the addition of 10 mM NADPH or NADP+ at 25 hours, the time at which the reaction achieves approximately maximum titers. The inset is a magnification of the final portion of the graph. NADPH addition raises isobutanol titer, while NADP+ reduces isobutanol titer. c The effect of the addition of 100 mM isobutanol at 25 hours on the NADPH levels at 25.5 h. The addition of isobutanol increases the NADPH concentration. d Isobutanol titer over time with addition of an organic overlay. Error bars in each panel represent the standard deviation of technical triplicates. Open circles in panel c show the individual data points. Source data are provided as a Source Data file.

