Figure 3.

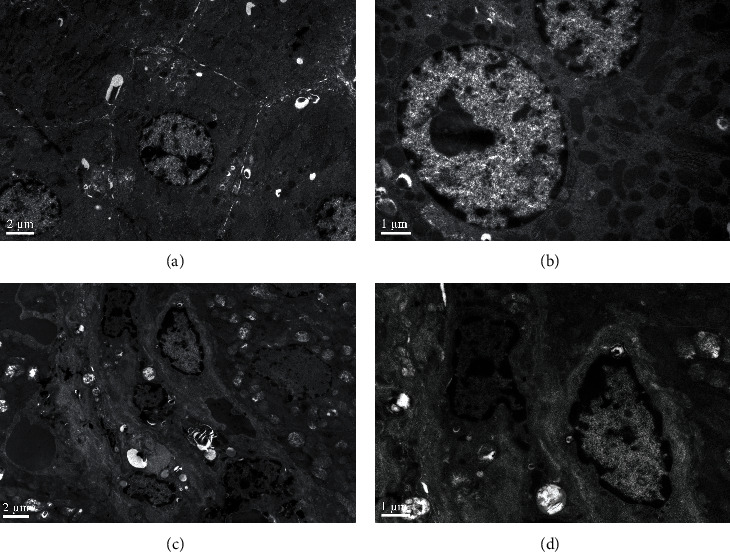
TEM photographs of liver tissue: (a and b) from the control treatment; (c and d) from 8 mg Se/kg BW SeNP treatment. Scale bar = 2 μm and 1 μm.

TEM photographs of liver tissue: (a and b) from the control treatment; (c and d) from 8 mg Se/kg BW SeNP treatment. Scale bar = 2 μm and 1 μm.