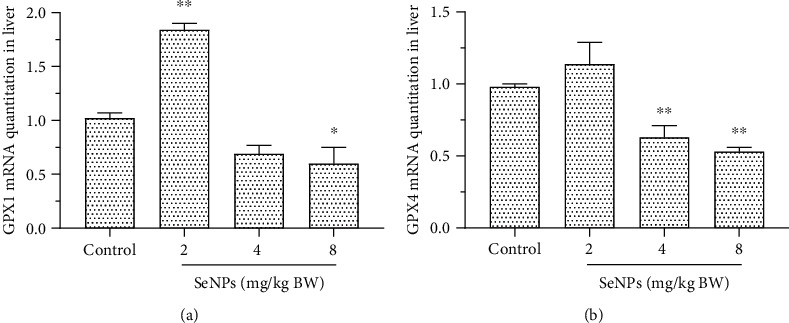
Figure 4.

Effect of SeNPs on the mRNA expression of GPX1 (a) and GPX4 (b) in the liver. Data are expressed as the mean ± SD, n = 6. ∗ and ∗∗ indicate significant difference as compared with the control treatment (P < 0.05 and 0.01, respectively). GPX1: glutathione peroxidase 1; GPX4: glutathione peroxidase 4.
