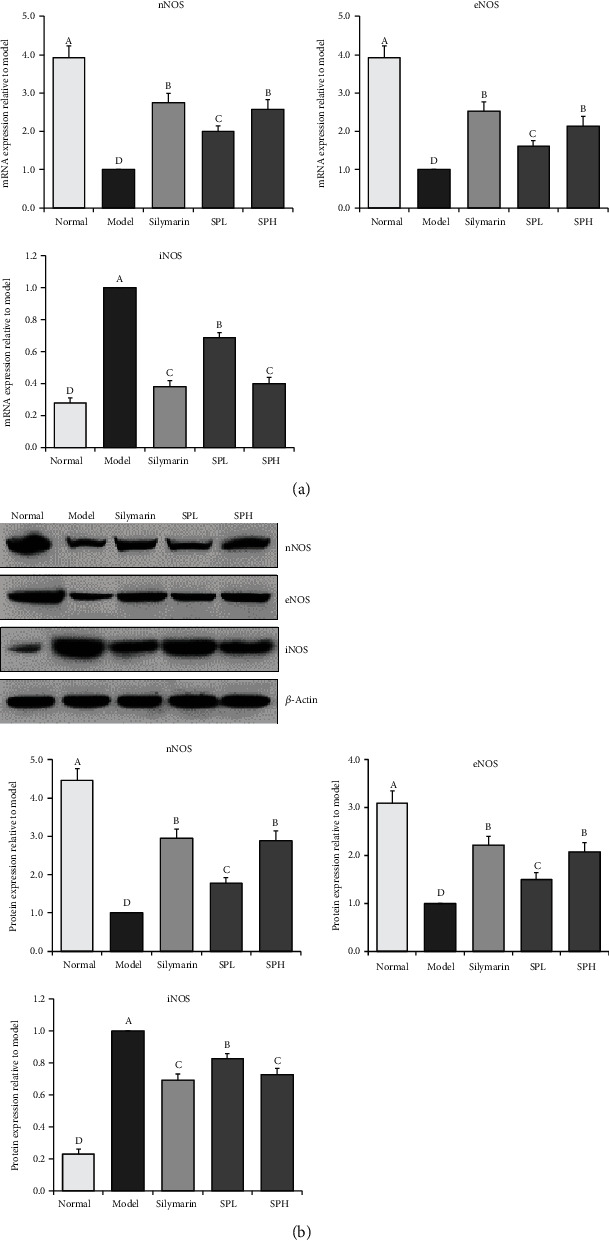
Figure 7.

nNOS, eNOS, and iNOS mRNA (a) and protein (b) expression in liver tissue of mice with CCl4-induced hepatic damage. Values presented are the mean ± standard deviation (N = 10/group). Sample data in each group come from normal distribution, and the difference in variance between the two groups was significant (P > 0.05). a-eMean values with different letters over the bar are significantly different (P < 0.05) according to Tukey's honestly significant difference. Normal: untreated mice; model: CCl4-treated mice; SPL: 100 mg/kg Shoumei polyphenols and CCl4-treated mice; SPH: 200 mg/kg Shoumei polyphenols and CCl4-treated mice; silymarin: 200 mg/kg silymarin and CCl4-treated mice.
