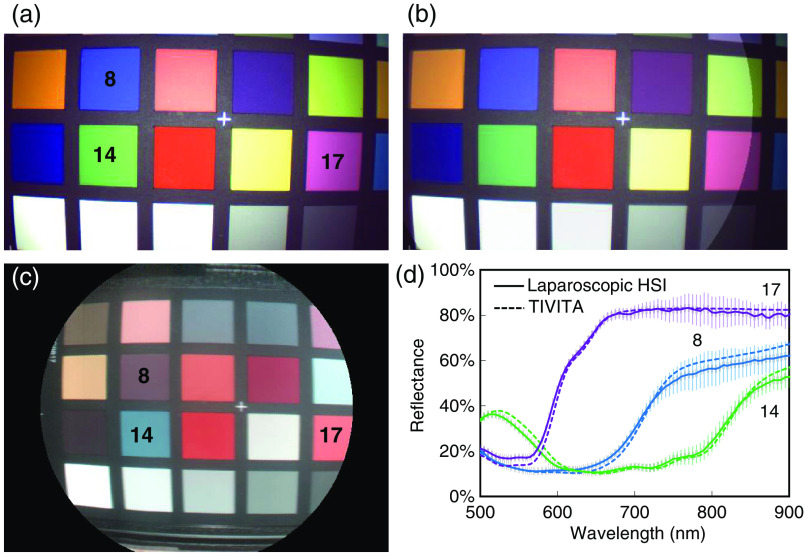
Fig. 5.
Simultaneous video and HSI of the ColorChecker target: (a) video from the color image sensor (rgbS). (b) Registration and semitransparent overlay of the rgbS video and color image from HSI after one-time calculation of the homography. (c) Color image calculated during hyperspectral data acquisition. Pseudocolors are calculated from the measured reflectance between 530 and 725 nm, due to the lower SNR of the TIVITA system below this range. (d) Reflectance of three exemplary ColorChecker patches measured with the laparoscopic HSI and TIVITA system. Error bars indicating the standard deviations for the patches recorded with the laparoscopic system. Standard deviations for the TIVITA system are and omitted for clarity.

