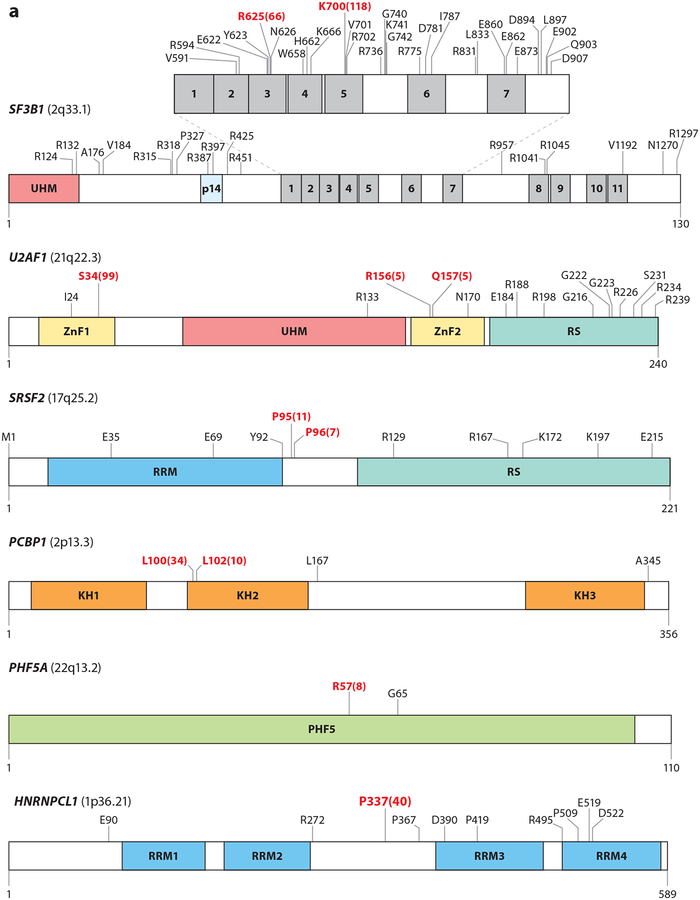
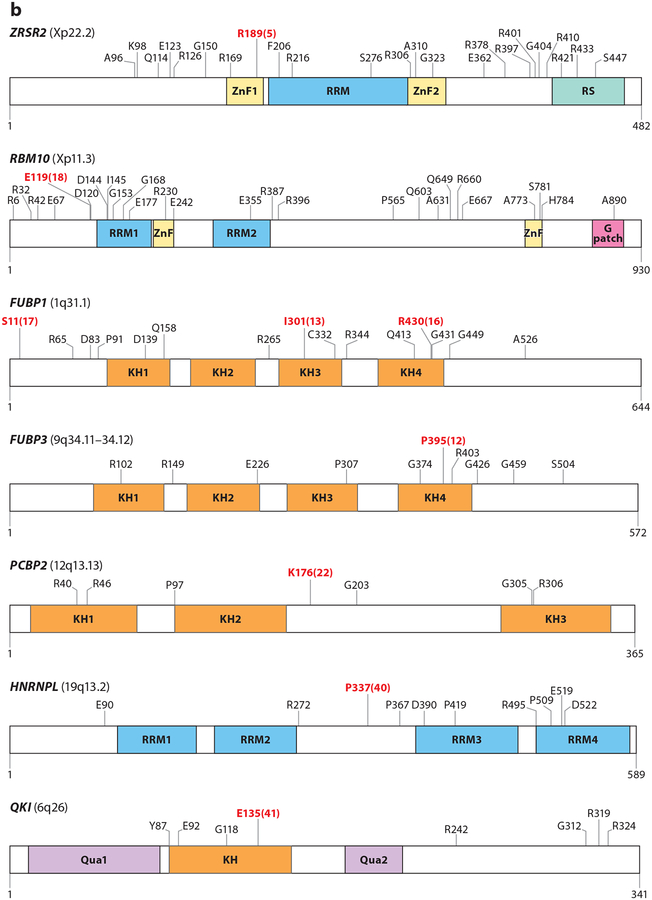
Figure 2.
Mutations in RNA splicing factors in cancer. For each protein, mutations occurring in at least three samples are annotated, with the exceptions of FUBP1 and RBM10, where mutations occurring in at least four samples are annotated. Residues in red represent the most frequently reported hot spot mutations, and the total numbers of observed occurrences are displayed in parentheses. Residue and frequency data were mined from cBioPortal (Cerami et al. 2012) and the image was created with DOG 1.0 (Ren et al. 2009). Mutations in proteins in panel a are commonly thought to induce change-of-function mutations, whereas mutations in proteins in panel b typically result in loss-of-function mutations. Colored regions within each protein diagram represent known domains.


