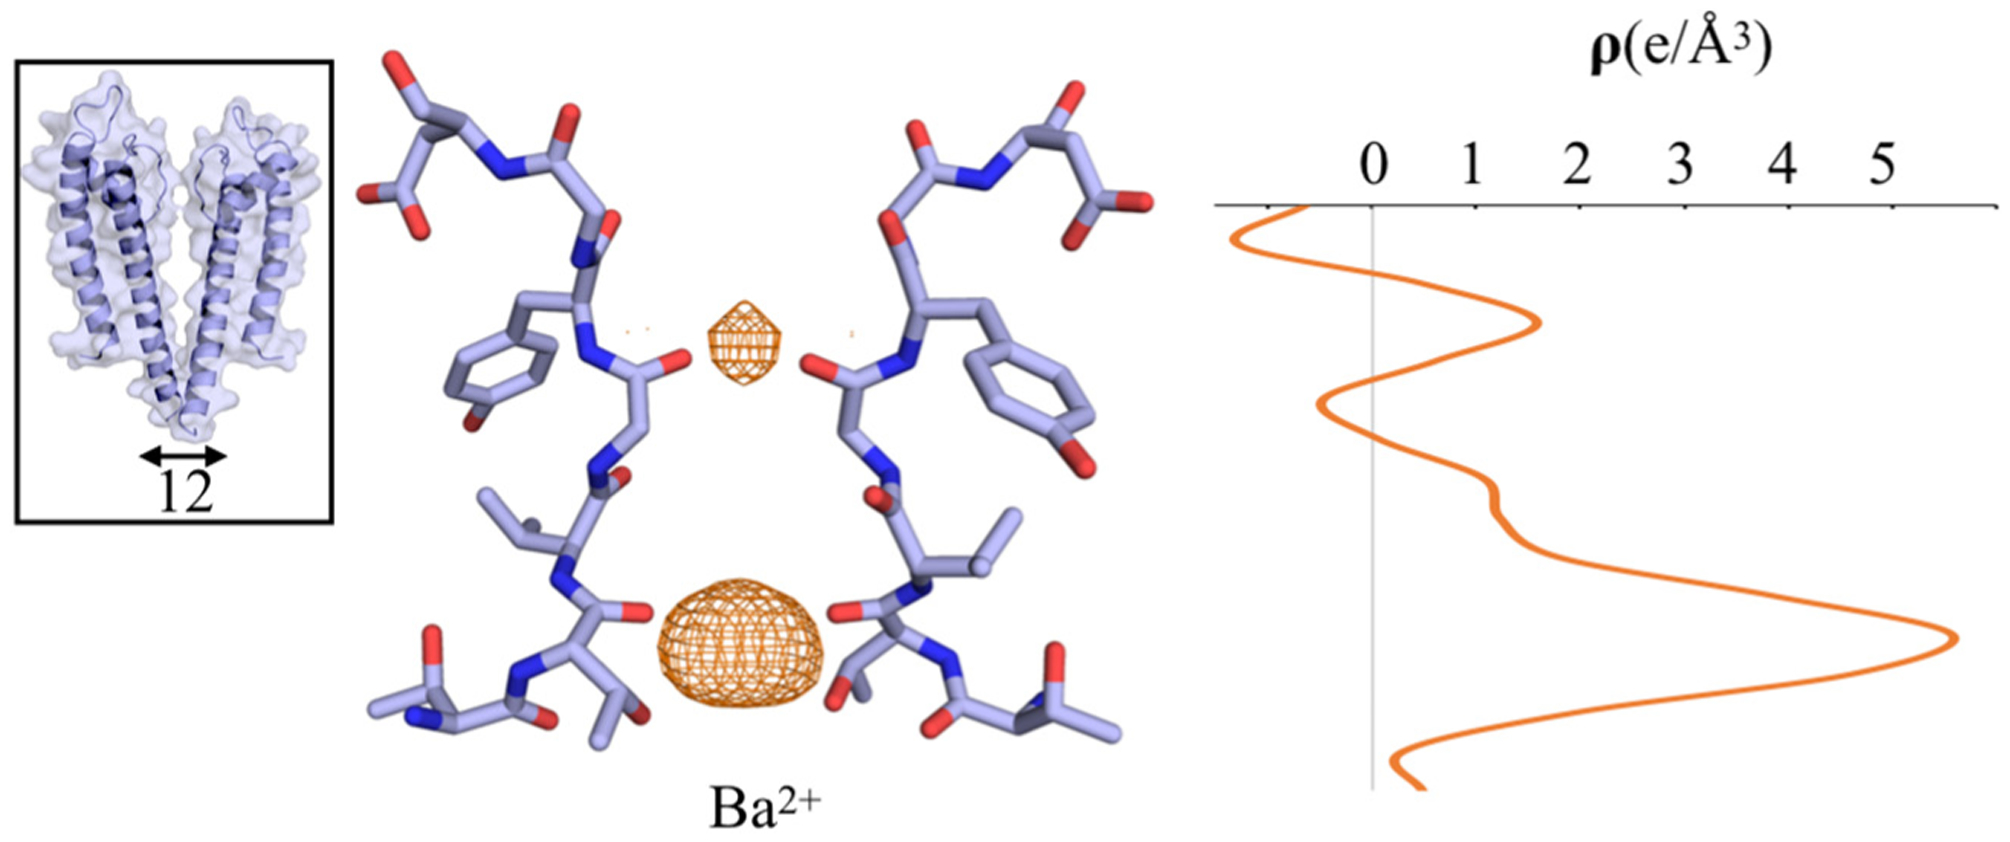
Figure 4.

Crystal structure of wt KcsA incubated with Ba2+/Na+ for 10 min prior to crystallization. A view of the selectivity filter showing a closed-constricted conformation. Anomalous Fourier difference map for Ba2+ (orange mesh) contoured at 3σ to show the weak density between S1 and S2. The inset on the left shows an overall closed-constricted KcsA structure. The Cα–Cα Thr112 distance of the inner gate is shown by the black arrow. On the right, the one-dimensional electron density profile of the anomalous scattering is shown along the z-axis of the selectivity filter.
