
Figure 12.
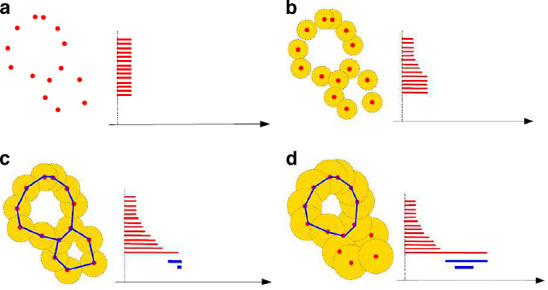
Illustration of the filtration of the distance function of a cloud of points. For the birth of each point, we create an interval (bar) in the persistence diagram. As we increase the radius of the points, some components die (and merge) as the circles start to overlap. The persistence diagram takes track of this by putting an end to the interval (b). As the radius of the circle further increases, we form new, one-dimensional, connected components (the holes, blue in c) and all the intervals associated with single points come to an end. The only interval that never dies is due to the union of all points. The figure is a modified version of the illustration from Chazal and Michel.229