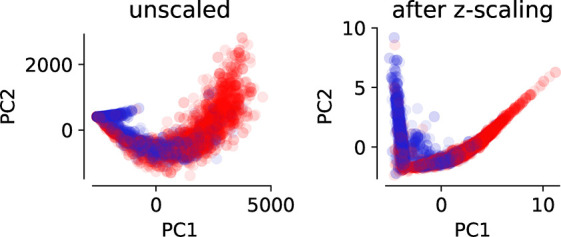
Figure 15.

Influence of scaling, here standard scaling (z-scaling), of features on the dimensionality reduction using PCA. For this example we used the data from Boyd et al. and performed the PCA on the feature matrix of pore properties descriptors and plot the data in terms of the first two principal components (PC1 and PC2). We then color code the structures with above-median CO2 uptake (red) different from those with below-median CO2 uptake (blue) and plot the points in random order. It is observable that the separation after scaling is clearer.
