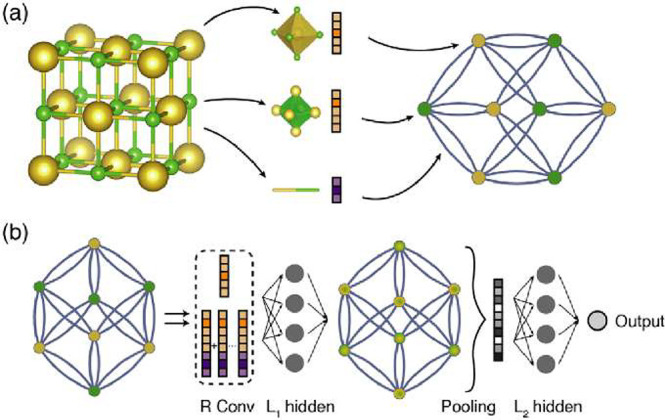
Figure 24.

Schematic illustration of the crystal graph CNN developed by Xie and Grossman.223 Reprinted from Xie and Grossman.223 Copyright 2018 by the American Physical Society. After representing the crystal structure as a graph (a) by using the atoms as nodes and the bonds as edges, the graph can be fed into a graph CNN (b). For each node of the graph, K convolutional layers and L1 hidden layers are used to create a new graph that is then, after pooling, sent to L2 hidden layers.
