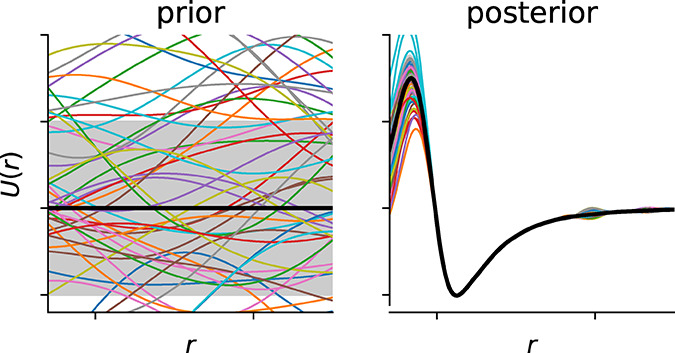
Figure 28.

Samples from the prior and posterior distributions for the fit shown in Figure 27 using the same scale for the axes. Here, we assume a zero mean (thick black line) for the prior but the mean in the posterior is no longer zero after the inference. The standard deviation is shown as a gray area.
