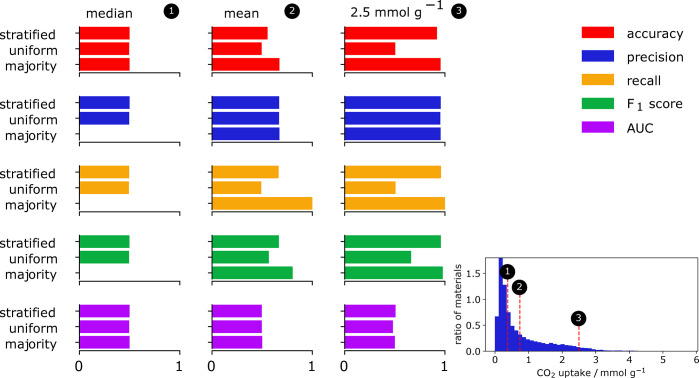
Figure 33.
Influence of class imbalance on different classification metrics. For this experiment, we used different thresholds (median, mean 2.5 mmol g–1) for CO2 uptake to divide structures in “high performing” and “low performing” (see histogram inset). That is, we convert our problem with continuous labels for CO2 uptake to a binary classification problem for which we now need to select an appropriate performance measure. We then test different baselines that randomly predict the class (uniform), i.e., sample from a uniform distribution, that randomly draw from the training set distribution (stratified), and that only predict the majority class (majority). For each baseline and threshold, we then evaluate the predictive performance on a test set using common classification metrics such as the accuracy (red), precision (blue), recall (yellow), F1 score (green), and the area under the curve (AUC) (pink). We see that by only reporting one number, without any information about the class distribution, one might be overly optimistic about the performance of a model; that is, some metrics give rise to a high score even for only random guessing in the case of imbalanced distributions. For example, using a threshold of 2.5 mmol g–1 we find high values for precision for all of our sampling strategies. Note that some scores are set to zero due to not being defined due to zero division.

