
Figure 35.
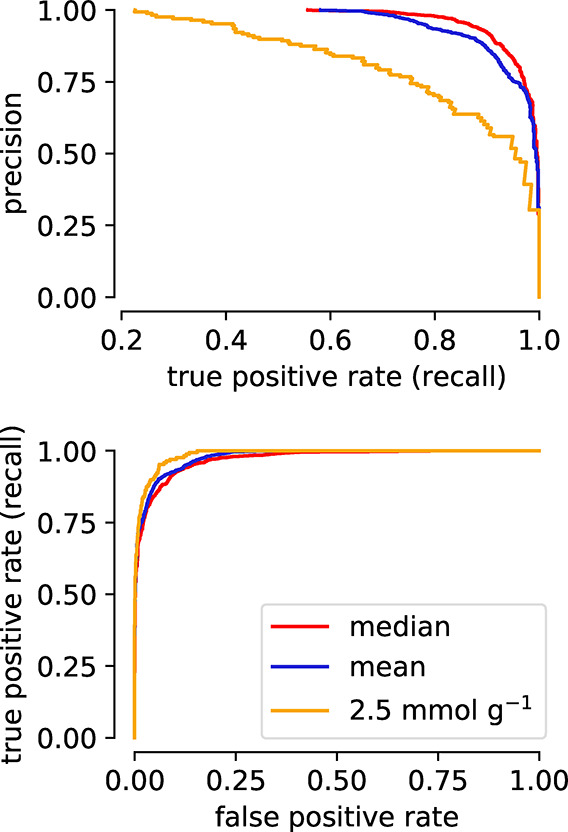
Comparison of precision-recall (top) and ROC (bottom) curves for different thresholds for the binary classification of CO2 uptake (same as for Figure 5). For this example, we fitted a GBDT classifier on the data set from Boyd et al.13 We can observe that for increasingly imbalanced class distributions (e.g., higher threshold for “high” performing MOFs, i.e., there are few of them) the difference between the shape of the precision-recall curve and the ROC, as well as the area under those curves, is more different. For imbalanced classes, the precision-recall curve (and the area under this curve) is a more sensible measure of model performance.