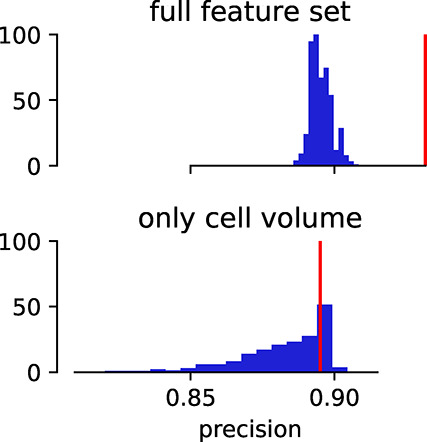
Figure 37.

Example of a y-scrambling analysis to assess the significance of a performance metric. For this example, we built two simple GBDT classifiers that attempt to classify the materials from Boyd et al.13 into structures with high and low CO2 uptake, respectively. We trained one of them using RACs and pore property descriptors and the other one using only the cell volume as descriptor. We also measure the performance using the AUC and can observe that the model, trained on the full feature set, can capture a relationship in the real data (red line) and significantly (p < 0.01) outperforms the models with permuted labels (bars). The model trained only on the cell volume does not perform better than random.
