
Figure 4.
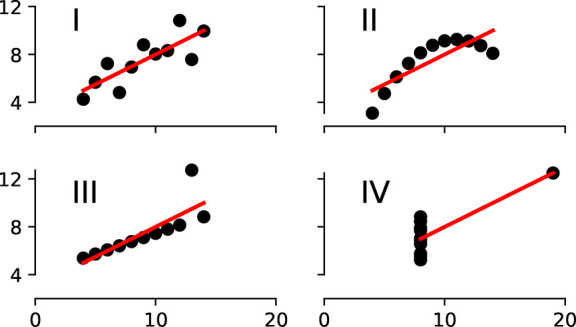
Anscombe’s quartet shows the importance of visualization.92 The four data sets have the same mean (7.50), standard deviation (1.94), and regression line, but still look completely different.
Official websites use .gov
A
.gov website belongs to an official
government organization in the United States.
Secure .gov websites use HTTPS
A lock (
) or https:// means you've safely
connected to the .gov website. Share sensitive
information only on official, secure websites.
Anscombe’s quartet shows the importance of visualization.92 The four data sets have the same mean (7.50), standard deviation (1.94), and regression line, but still look completely different.