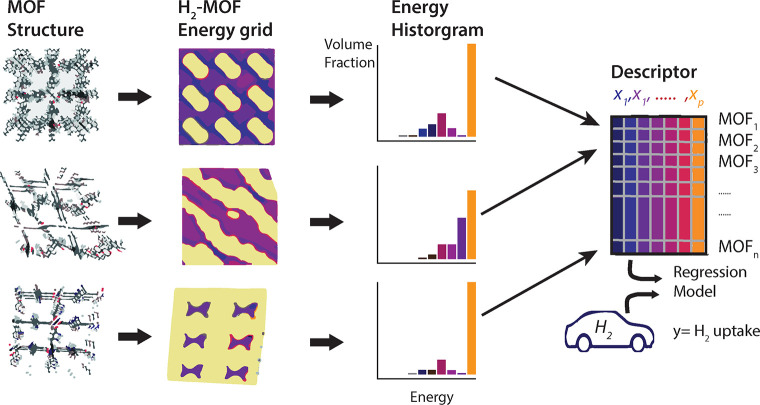
Figure 41.
Overall machine learning workflow used by Bucior et al.253 to predict the H2 storage capacity of MOFs. For each MOF, an energy grid within the MOF unit cell was computed, from which an energy histogram was obtained, which is a feature in their regression model that they used to predict the H2 uptake. Figure adopted from Bucior et al.253

