
Figure 42.
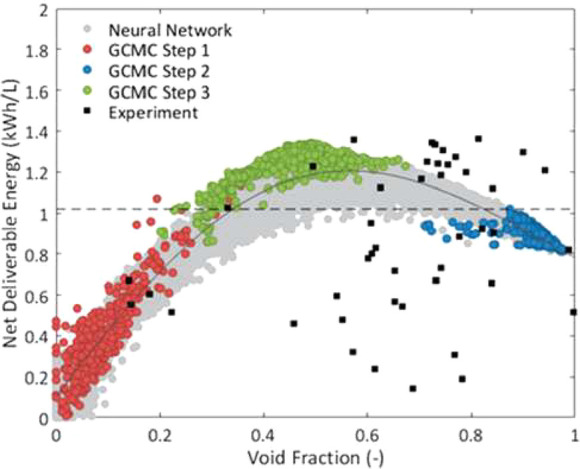
Net deliverable energy as a function of the void fraction for the data predicted using the NN and experimental data. The solid dark line shows the Langmuir model. Figure reproduced from Thornton et al.440
Official websites use .gov
A
.gov website belongs to an official
government organization in the United States.
Secure .gov websites use HTTPS
A lock (
) or https:// means you've safely
connected to the .gov website. Share sensitive
information only on official, secure websites.
Net deliverable energy as a function of the void fraction for the data predicted using the NN and experimental data. The solid dark line shows the Langmuir model. Figure reproduced from Thornton et al.440