

Abstract
Photodiode circuits show promise for the development of high-resolution retinal prostheses. While several of these systems have been constructed and some even implanted in humans, existing descriptions of the complex optoelectronic interaction between light, photodiode, and the electrode/electrolyte load are limited. This study examines this interaction in depth with theoretical calculations and experimental measurements. Actively biased photoconductive and passive photovoltaic circuits are investigated, with the photovoltaic circuits consisting of one or more diodes connected in series, and the photoconductive circuits consisting of a single diode in series with a pulsed bias voltage. Circuit behavior and charge injection levels were markedly different for platinum and sputtered iridium–oxide film (SIROF) electrodes. Photovoltaic circuits were able to deliver 0.038 mC/cm2 (0.75 nC/phase) per photodiode with 50-μm platinum electrodes, and 0.54-mC/cm2 (11 nC/phase) per photodiode with 50-μm SIROF electrodes driven with 0.5-ms pulses of light at 25 Hz. The same pulses applied to photoconductive circuits with the same electrodes were able to deliver charge injections as high as 0.38 and 7.6 mC/cm2 (7.5 and 150 nC/phase), respectively. We demonstrate photovoltaic stimulation of rabbit retina in-vitro, with 0.5-ms pulses of 905-nm light using peak irradiance of 1 mW/mm2. Based on the experimental data, we derive electrochemical and optical safety limits for pixel density and charge injection in various circuits. While photoconductive circuits offer smaller pixels, photovoltaic systems do not require an external bias voltage. Both classes of circuits show promise for the development of high-resolution optoelectronic retinal prostheses.
Keywords: Biomedical electrodes, biomedical telemetry, neural stimulation, photodiodes, retinal prosthesis
I. Introduction
THE development of neural prostheses has spurred extensive research into implantable power and data delivery systems. Visual prostheses, in particular, have relatively high data and power delivery requirements since they require neural stimulation arrays of up to several thousand electrodes [1]–[3]. Several retinal prosthetic systems utilize percutaneous cables [4]–[6]; however, these connections are difficult to keep sterile and can cause severe scarring [7]. Wireless systems utilize either radio-frequency [8]–[10] (RF) or optical [1], [2], [10]–[12] telemetry systems to deliver visual information without these directly wired connections. RF telemetry systems typically use pairs of inductively coupled coils to receive power and/or data, while optical systems generally use photodiodes to convert light into electrical signals.
Several photodiode-based prostheses have so far been constructed and tested. The first generation of photodiode prostheses utilized passive, photovoltaic photodiode circuits, with photodiodes directly connected to retinal stimulation electrodes and driven with the ambient light entering the eye [1], [2]. However, these devices were unable to provide direct neural stimulation for two reasons. First, ambient illumination provides insufficient light intensity to power photodiode-based retinal stimulation by several orders of magnitude [13]. Second, the interface between the electrode and retinal tissue polarizes to oppose charge injection under steady-state illumination; thus, passive photodiode devices are best driven by pulsed light [12], [13], not by relatively continuous ambient light. Both of these limitations may be overcome by using pulsed, near-infrared (IR) (to avoid interfering with surviving photoreceptors) light several orders of magnitude brighter than ambient. Indeed, IR flashes have been shown to produce neural activity in the superior colliculus (a region of the brain which receives visual input from the optic nerve) of both blind and sighted rats implanted with subretinal photodiode arrays; the same flashes evoked no response in control animals implanted with electrically inactive devices [14]. Alternatively, extra power may be supplied to amplify the photodiode signals. One of these active devices has successfully restored basic reading ability to a previously blind subject [3].
In this study, we investigate the use of several different passive (photovoltaic) and active (photoconductive) photodiode circuits to convert high-intensity, pulsed near-IR light to stimulation current. This illumination may be delivered by video goggles utilizing near-IR lasers (870–920 nm) without interfering with remaining vision [12]. Since the retina is transparent at these wavelengths (with an absorption coefficient not exceeding 0.1 cm−1) [15], an array of these circuits may be placed either epiretinally or subretinally. The charge injection characteristics and limits of each circuit have been measured in phosphate buffered saline (PBS) using platinum and sputtered iridium–oxide film (SIROF) electrodes, two materials often used in neural stimulation. Finally, we report a measurement of photovoltaic stimulation threshold in the rabbit retina using a photodiode array.
II. Circuits
A. Photodiode Operation
When photons of sufficient energy strike a photodiode, they can excite mobile electron-hole pairs, producing a photocurrent Ip that travels against the polarity of the diode. This photocurrent is linearly proportional to incident light power P, with the proportionality constant α known as responsivity
| (1) |
This current is usually modeled [16] as a current source in parallel with the diode, so that the total diode current ID is given by
| (2) |
The first term is the Shockley ideal diode equation [17], which parameterizes diode behavior by the saturation current IS and ideality factor n, which varies from 1 to about 2 depending on the fabrication process and semiconductor material. VT is the thermal voltage, which is approximately 26.7 mV at body temperature [17] (310 K). In practice, any photodiode will also have series resistance due to the ohmic behavior of device characteristics, such as semiconductor contacts, so a full model must include the voltage lost across this resistor Rs
| (3) |
Since the voltage V across the entire device is the sum of VR and VD, the full voltage/current relationship is given by
| (4) |
This can be solved easily, either numerically or analytically, with the Lambert W function [18]. The measured I–V curves of the commercially purchased diodes used in this study were well-described by n = 2, IS = 140 nA, and Rs = 200 Ω; however, significant diode-to-diode variation was observed. Fig. 1(a) shows examples of I–V curves for a single diode. The I–V curve of a non-illuminated photodiode exists solely in quadrants I and III, where the I · V product is positive, indicating that the circuit draws power. However, the I–V curve of an illuminated photodiode passes through quadrant IV (positive voltage and negative current), where the I·V product is negative. In this quadrant, the circuit can supply power to an external load. Physically, this power is derived from the energy of the photons which create the electron-hole pairs that make up the photocurrent.
Fig. 1.

Examples of current–voltage sweeps for (a) one, two, and three photodiodes in series operating photovoltaically. (b) A single diode operating photo-conductively, and (c) again three photodiodes in series, with a shunt resistor to increase conductivity during the light off, “recharge” phase. The photocurrent Ip is proportional to the light power incident on each photodiode.
B. Photovoltaic versus Photoconductive Circuits
When one or more photodiodes are directly connected to a passive load, they are said to be operating photovoltaically. The photovoltage of a single silicon diode is limited to about 0.5 V at physiologically safe light intensities [12], only a fraction of the approximately 1.4-V size of the “water window” range of potentials through which a platinum or SIROF electrode may be polarized while avoiding the electrolysis of water, a frequently used criterion for safe stimulation in a physiological environment (see Section III). The 1.4-V water window is defined as the voltage between the oxidation and reduction potentials of water (−0.6 and 0.8 V versus Ag|AgCl at pH 7).
The maximum photocircuit voltage can be increased by placing photodiodes in series so that their individual voltages sum. Assuming that each diode is illuminated equally, the I–V relationship for m photodiodes connected in series is
| (5) |
Setting ID = 0 determines the maximum voltage which may be delivered photovoltaically
| (6) |
where Vp is the maximum potential produced by a single photodiode, called the photovoltage. The I–V curves for two and three diodes in series are shown in Fig. 1(a). Three photodiodes provide three times more voltage than a single diode system; however, they require three times more light power.
Deliverable voltage may also be increased by placing a pulsed bias potential VB(t) across a single photodiode, as shown in Fig. 1(b). Mathematically, VB(t) is a simple pulse function, aligned with the incoming light pulse
| (7) |
Adding a bias simply shifts the I–V curve of a single photodiode
| (8) |
with the maximum stimulation voltage given by
| (9) |
In the interpulse, the “recharge” phase VBoff is chosen to bias the microelectrode at one end of the water window. VBon is then chosen so that Vmax PC = 1.4 V is the size of the water window. By biasing the electrode, the full electrochemical charge capacity of the electrode can be accessed (though sometimes other values may be chosen, as will be discussed later). The I–V curves of a photoconductive circuit are shown in Fig. 1(b).
C. Electrode/Tissue Load
Regardless of the circuit/illumination specifications, the electrical interface between a retinal prosthesis and the tissue is through patterned microelectrodes. Stimulation current is driven from an “active” electrode placed close to the target cells to a (typically much larger) counter electrode located some distance from the active electrode. The maximum amount of charge that can be driven into the electrode without causing irreversible Faradaic reactions is called the charge injection limit, and depends strongly on how the electrodes are driven. These limits are defined as the charge necessary to polarize the electrode to either the water reduction or oxidation limit during a stimulation pulse. Much research [19]–[24] has concentrated on ways of maximizing the electrochemical charge capacity within this water window. The consequences of exceeding these voltage limits include gas generation, tissue damage, and electrode delamination [23].
In addition to this capacitive charge storage at the electrodeelectrolyte interface, the load impedance also has a strong resistive component from the resistance of tissue between the two electrodes, which is a function of electrode size and geometry. The access resistance RA of a disk electrode with a distant large-area return can be expressed as [25]
| (10) |
where κ is tissue conductivity and a is the electrode radius. Thus, for the 50-μm-diameter microelectrodes used in this study, the 26-mS/cm conductivity PBS represents a load of approximately 4 kΩ. The conductivity of the PBS used in this study is significantly higher than the retinal conductivity [21], due to the presence of highly nonconductive cell membranes in the retina. Thus, in vivo tests of the same circuits will likely yield smaller charge injection values (see Section V).
Charge injection for both platinum and SIROF occurs with a combination of double-layer charging and Faradaic reactions at the electrode-tissue interface. For platinum, the Faradaic reactions are confined to the electrode surface with double-layer capacitance also contributing significantly to the overall charge transfer. Reversible Faradaic reactions are more dominant for the higher charge capacity SIROF, occurring throughout the 3-D structure of the SIROF film which, in these studies, is about 300 nm thick.
D. Shunt Resistor
During the stimulation pulse, the electrode accumulates charge. After the pulse, the electrode discharges through the photodiodes, ensuring charge balance. Placing photodiodes in series decreases the overall conductance of the circuit, which can lead to incomplete discharging of the electrode between light pulses, especially for the larger SIROF charge capacity. For this reason, we experimented with placing a shunt resistor across the series of photodiodes. This resistance should be larger than the load resistance so that it does not divert a lot of current from the stimulation pulse, but small enough so that it appreciably accelerates interpulse electrode equilibration. In this case, total current I is the sum of the diode current ID and the current conducted through the parallel resistor Rp
| (11) |
where ID is, as defined previously in (5). Fig. 1(c), shows the effect of a shunt resistor on the I-V curve of three photodiodes in series.
III. Methods
A. Electrolytes
Phosphate-buffered saline (PBS) was used as the electrolyte in this study. The PBS (130 mM NaCl, 22 mM NaH2PO4·H20, 81 mM Na2HPO4·7H20) had a conductivity of 26 mS/cm, and a pH of ~ 7.2. The active and counter electrodes were placed in a beaker with PBS, along with a standard Ag|AgCl reference electrode. Argon was bubbled through the electrolyte to reduce oxygen content, consistent with a physiological environment. All electrodes were allowed to equilibrate in the electrolyte for 15 min before measurements were taken.
B. Illumination and Photocircuits
A 905-nm laser diode was used to project square, 0.5-ms light pulses onto a 1.0-cm, homogenous spot of uniform intensity using a microlens array diffuser (ThorLabs part #ED1-C20). Discrete photodiodes (sDigiKey PDB-V601-1-ND) were placed in this spot, and could be wired into one, two, three, four, and five photodiode circuits. Light power was controlled by the current driven through the laser diode, and measured by deflecting some of the laser beam onto a power meter (Fig. 2). This measurement was calibrated to provide the total light power falling on each diode. The diodes were relatively large (1.4 mm2), but are still useful for measuring circuit dynamics from similarly performing smaller devices, which will necessitate larger irradiances to achieve the same light power.
Fig. 2.

Diagram of the experimental setup. Active and reference electrode potentials are monitored while a laser diode pulses light onto the photocircuit with the counter electrode connected to ground. A small series resistor measures current, while a photodetector measures light power and beam shape.
The 905-nm measurement wavelength was chosen since it maximized the (wavelength-dependent) responsivity of the chosen photodiodes. In a prosthetic system, other wavelengths can be used as long as they are not visible (>~775 nm) and are relatively efficiently converted to electrical current by silicon photodiodes (<~1000 nm).
Diode current-voltage characteristics were measured using an Agilent 4145C Semiconductor Parameter Analyzer. Photovoltaic measurements were taken by placing a series of 1–5 photodiodes between the active and counter electrodes. An active electrode is “anodally stimulated” when it is driven to a positive potential with respect to the counter electrode. When driven to a negative potential, it is said to be “cathodally stimulated.” In photovoltaic circuits, stimulation polarity can be switched by reversing the diode terminals. Anodal stimulation is provided when the active electrode is connected to the p-doped region of the diode, while the counter is connected to an n-doped region; for cathodal stimulation, it is the opposite.
Photoconductive measurements were taken by placing a single photodiode in series with a pulsed dc voltage source. During the stimulation phase, when the light is turned ON, the dc voltage reverse-biases the diode so that it acts as a light-controlled current-limiting element. During the OFF phase, the dc voltage biases the electrodes to one end of the water window: either −0.6 V or +0.8 V with respect to the Ag|AgCl reference electrode. A system biased at +0.8 V can provide cathodal stimulation, while a system biased at −0.6 V can provide anodal stimulation. In all, six circuits (5 photovoltaic and 1 photoconductive) were investigated in anodal and cathodal polarities for platinum and SIROF electrodes, for a total of 6 × 2 × 2 = 24 different configurations.
C. Active and Counter Electrodes
Platinum disk electrodes were fabricated by melting the tip of a 50-μL glass capillary tube around 50-μm platinum wire. The resulting glass-embedded wire was polished so that only a 50-μm disk was exposed, resulting in a geometric surface area (GSA) of 1960 μm2. Similarly, 50-μm SIROF disk electrodes with the same GSA were fabricated in an array on a polyimide substrate, as described in [26]. Insulated gold leads were patterned along the surface of the polyimide from the electrode array to connection pads 5 cm away. The cathodic charge storage capacity (CSCc) of both microelectrodes was evaluated by integrating the cathodic current measured during a single sweep of a cyclic voltammogram (EG&G Princeton Applied Research potentiostat/galvanostat Model 273A) between +0.8 and −0.6 V (Fig. 3). The platinum electrode had a CSCc of 2.1 mC/cm2, while the SIROF electrode had a CSCc of 57 mC/cm2, both consistent with values reported in the literature [27]. Large counter electrodes (GSA = 1 cm2) were also fabricated from both materials.
Fig. 3.
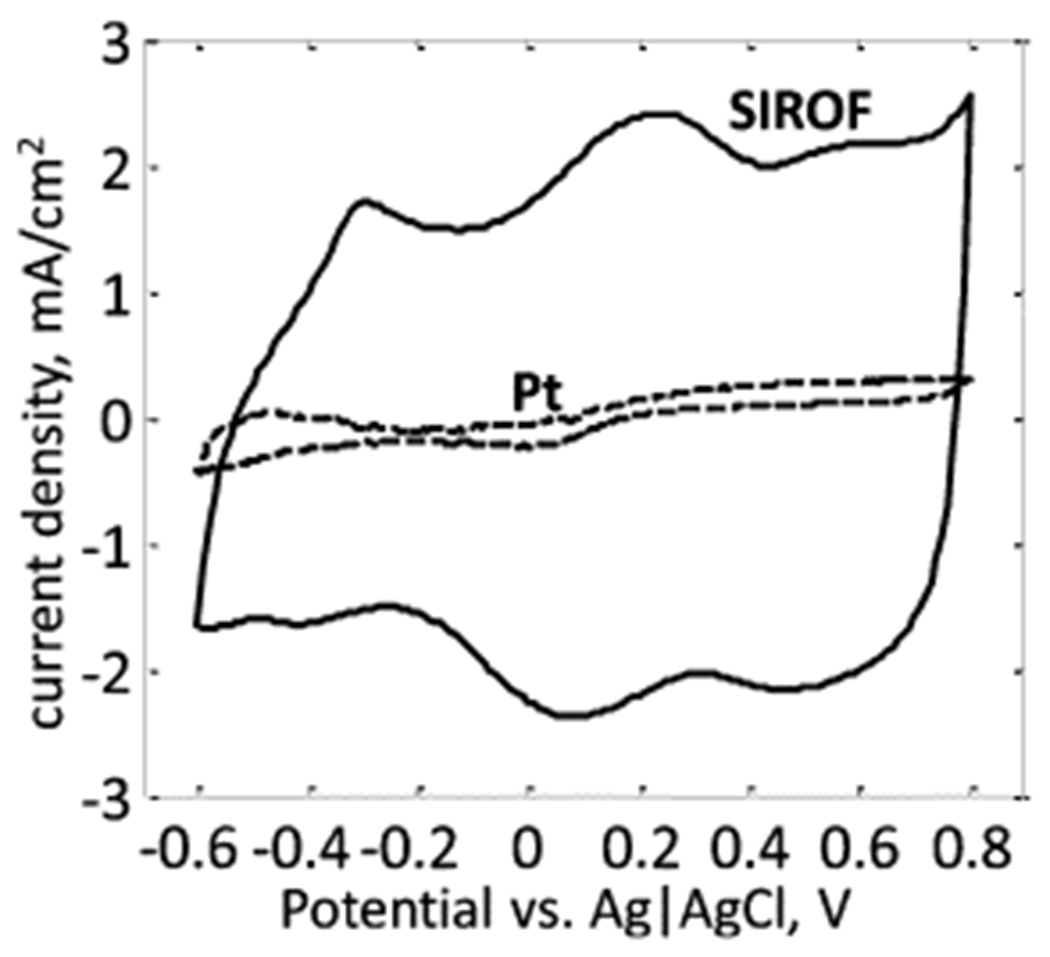
Cyclic voltammograms of the 50-μm platinum and 50-μm SIROF disk electrodes, taken in PBS at a sweep rate of 50 mV/s. The platinum microelectrode had a charge injection of CSCC = 2.1 mC/cm2, while the SIROF microelectrode had a CSCC of 57 mC/cm2.
D. Data Recording
A diagram of the measurement system is shown in Fig. 2. The photodiode system converts incident light into an electrical signal that is delivered to the electrode/electrolyte load. A small series resistor was used to measure current waveforms, while potentials on the active and reference electrodes were measured using 10-MΩ input-impedance voltage probes; the counter electrode was connected to the ground of the oscilloscope. Measurements were made at several different light powers for each photodiode circuit. Light was pulsed until a steady state was achieved, and then the current and voltage waveforms were recorded. An electronically controlled switch was used to disconnect the active electrode from the circuit for 10 μs, immediately after the light pulse ends, to stop current flow and directly measure electrode polarization. The measurement was terminated if this polarization reached either end of the water window. The illumination system could provide a maximum light power of ~ 500 μW per diode, which greatly exceeded the light-to-current conversion range of interest.
IV. Results and Discussion
A. Charge Injection Dynamics
Fig. 4 shows the light power, current, and voltage waveforms for two of the circuits investigated: 1) a photoconductive platinum system and 2) a three-diode photovoltaic SIROF system, both configured for anodal stimulation. Though these are only two of the 24 systems investigated, the results are broadly representative. The measured access resistance of the 50-μm electrode in PBS was measured to be 14 kΩ, of which approximately 4 kΩ is calculated ohmic resistance from the 26-mS/cm electrolyte (10). The remaining access resistance originates from the current-sensing resistor, electrode contacts, and additional overpotential contributions which are difficult to separate from purely resistive elements of the circuit [22]. This resistance determines the slope of the load lines in Fig. 4(d) and (h) and, hence, governs the electrical dynamics of the stimulation pulse.
Fig. 4.

(a) Pulsed bias voltage, (b) current, and (c) active electrode voltage for a 50-μm platinum microelectrode driven at 25 Hz by the photoconductive circuit shown inset in (a) at the light intensities shown in (e). Pulse dynamics can be understood by (d) plotting resistive load lines on top of the photocircuit I–V curves. All pulses begin at the same initial condition 1. Their 1-2-3-4-1 cyclical movement in potential versus current phase space is confined to the photocircuit I–V curves. The plots in the second column show (f) current and (g) active electrode voltage for a 50-μm SIROF microelectrode driven at 25 Hz by the photovoltaic circuit and light intensities shown in (e). Again, pulse dynamics can be understood as the 1-2-3-4-1 cyclical movement in potential versus current phase space (h).
1). Platinum:
As shown in Fig. 4(b) and (c), two fundamental regimes could be discerned: current limited and voltage limited. The circuit dynamics can be understood by viewing the experimentally observed circuit I–V curves at the light intensities shown in Fig. 4(e), with the photocircuit current and voltage plotted at four time points: just before the light pulse arrives (1), right after it arrives (2), right before it ends (3), and right after it ends (4).
For low light intensities, the load line intersects the diode I–V curve close to the origin, where it is very flat. In this case, the stimulation current is limited by the photocurrent, which is proportional to light intensity. The resulting stimulation pulses are “current-limited,” and current waveforms linearly replicate the light intensity waveforms, thereby providing simple linear optical control of the stimulating electrodes. However, the amplitude of these current pulses is limited by the finite voltage produced by the photocircuit, given by (6) and (9). At high light intensities, the load line intersects the diode I–V curve close to its maximum voltage, producing constant-voltage pulses. There is a transitional region between low and high intensities where the pulse starts out as current limited and ends as voltage limited.
The second, “recharge” current phase begins immediately after the light turns off. The photocircuit I–V curve moves to its non-illuminated position, biased to −0.6 V with respect to Ag|AgCl. The current/voltage again moves along a 14-kΩ load line from 3 to 4, as seen in Fig. 4(d). The electrode then discharges through the diode to the potential of the return electrode, before repeating the stimulation cycle again when the next light pulse arrives.
2). SIROF:
The three-diode photovoltaic anodal-stimulation SIROF system [Fig. 4(e)–(h)] displays qualitatively similar pulse dynamics, with a stimulation phase governed by the illuminated photodiode I–V curve in the third quadrant and a discharge through diodes in the interpulse recharge phase. Current and voltage-limited regimes are again observed, and are again defined by the location of point 2 on the illuminated photocircuit curve. However, SIROF has much higher electrochemical capacity than platinum (27× higher when measured by cyclic voltammetry as in Fig. 3). Thus, SIROF does not charge as quickly as platinum. Indeed, while the platinum electrode fully polarizes through the full 1.4-V water window by the end of the 0.5-ms pulse at high light intensities, the SIROF electrode never polarizes more than 0.2 V with a 3-diode system. As a result of this low polarization and the fact that discharge occurs through three diodes in series, point 3 always lands on a rather nonconductive portion of the nonilluminated I-V curve. This has two significant effects as follows.
The electrode never fully discharges back to the potential of the return at the 25-Hz pulse rate of the displayed data. Rather, a steady state is reached where the electrode partially discharges before recharging again.
There is no large, temporally confined electrode discharge phase. Rather, the discharge is slow, occurring during the entire interpulse period.
This is in contrast to the platinum photoconductive circuit, where the electrode fully discharged, and there was a large current pulse immediately following the cessation of illumination [Fig. 4(b)]. This difference is due to the smaller electrode charge capacity of platinum and the faster discharge through a single diode. As mentioned previously [see Fig. 1(c)], a shunt resistor can be used to speed electrode discharge through series photodiodes.
B. Charge Injection
Current as a function of light power per diode for various circuit configurations is plotted in Fig. 5(a)–(b), and total light power as a function of stimulation current is plotted in Fig. 5(c) and (d). At low light intensities, the pulses are current-limited, causing all of the curves to be linear with a slope equal to the photodiode responsivity of 0.6 A/W (dashed line). At high light intensities, the pulses are voltage-limited with slow-rising curves due to the logarithmic dependence of the photovoltage on light power (6). While all curves show this same qualitative behavior, there are large quantitative differences in where the transition between linear and logarithmic behavior occurs.
Fig. 5.
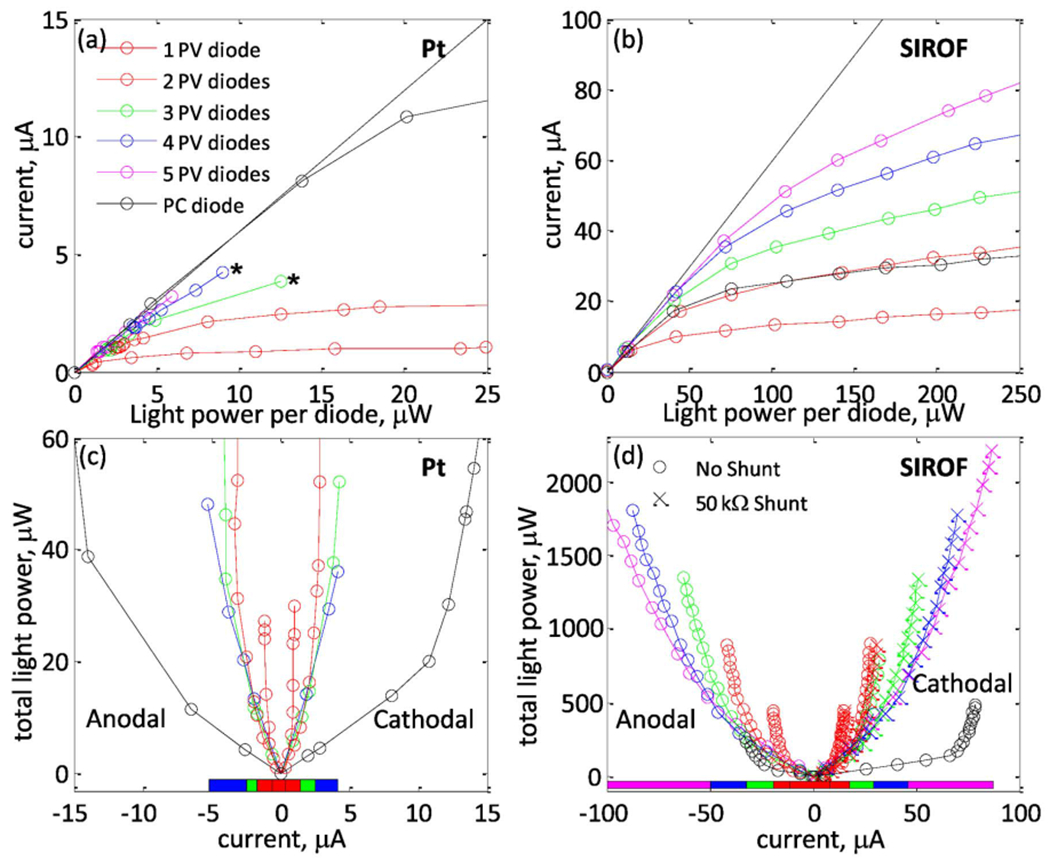
Current as a function of light power per diode for 1–5 photovoltaic (PV) series photodiodes and 1 photoconductive (PC) diode, measured at a 25-Hz pulse rate with (a) a 50-μm platinum electrode with cathodal current pulses (asterisks show where the electrochemical safety limit was reached) and (b) a 50-μm SIROF electrode driven with anodal current pulses. (c) and (d) show the total light power required for a desired stimulation current for each circuit, with the optimal photovoltaic circuit (the circuit which minimizes necessary light power for a given current) indicated by a colored bar beneath the curves. Five diodes are not shown in (c), as they are never optimal. Light-to-current conversion behavior is qualitatively similar for anodal and cathodal polarities, and for both electrode materials. Photoconductive measurements were taken as described in Section II-B.
1). Factors Determining Maximum Charge Injection:
Maximum charge injection is limited by three factors: 1) the charge capacity of the electrode, 2) the voltage produced by the photocircuit, and 3) the 1.4-V water window. Photoconductive circuits bias the electrode toward one side of this potential range, and then drive it toward the other. Photovoltaic circuits drive the active electrode anodally or cathodally from the electrode resting potential, which was measured to be approximately 0.05±0.05 V with respect to a Ag|AgCl reference electrode for platinum and SIROF electrodes. Thus, electrochemistry limits the change in electrode polarization to ~1.4 V for photoconductive circuits, 0.6–0.7 V for cathodal-stimulation photovoltaic circuits, and 0.7–0.8 V for anodal-stimulation photovoltaic circuits.
The finite charge capacity also provides a hard limit on how much current may be safely driven through the electrodes. Since SIROF has a much higher charge capacity than platinum, it can deliver much more charge when polarized through the same potential range (see Fig. 3). Indeed, comparing Fig. 4(b) and 4(f) illustrates that under the same illumination conditions, platinum quickly polarizes upon the arrival of light, resulting in a steep current fall-off, while SIROF polarizes much more slowly, resulting in a larger current transient. For this reason, SIROF electrodes can provide much higher currents than platinum ones.
Finally, current injection levels also depend on the voltage that is available from the photocircuit. This voltage affects charge injection in two fundamental ways as follows.
It limits the maximum potential through which an electrode may be polarized. For the relatively easily polarized platinum electrode, this is the dominant effect.
It determines the maximum current which may be driven through the electrode/tissue load via the standard ohmic relation V = I · R. This is the dominant effect for the relatively high charge capacity SIROF electrodes.
2). Photovoltaic Charge Injection:
Fig. 6 plots charge injection versus the number of diodes for photovoltaically driven series photodiodes with platinum and SIROF electrodes. For both electrode materials, charge injection increases approximately linearly for 1–3 photodiodes. For platinum, this ~ 0.038 mC/cm2 increase per diode is because each additional diode provides more voltage, allowing the electrode to be polarized through a greater fraction of the water window. An estimate from (6) (Ip = 0.6 A/W × 25 μW = 15 μA, IS = 25 nA, n = 2, VT = 25.85 mV at room temperature) gives a photovoltage of Vp = 330 mV, so that ~ 3 diodes are necessary to polarize the electrode to either end of the water window. Four diodes are sometimes more efficient than three at delivering the largest stimulation currents, as then each diode can be driven in the linear rather than logarithmic light-to-current conversion region. Five diodes behave similar to four diodes, but require 25% more total light, and so are never optimal.
Fig. 6.
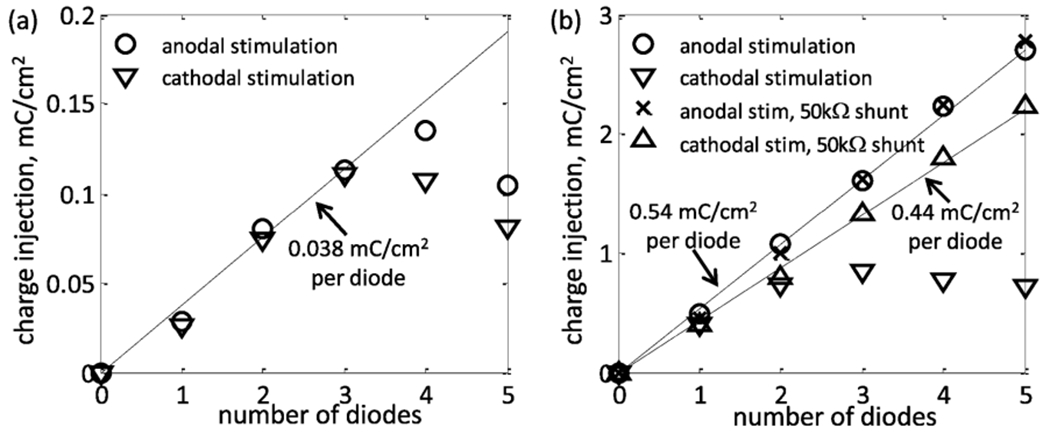
Maximum charge injection measured for 50 μm (a) platinum and (b) SIROF microelectrodes for 1-5 photodiodes in series driven photovoltaically at 25 Hz. In both cases, the charge injection initially increases linearly with an increasing number of photodiodes due to an increase in the available voltage. Series photodiodes slow the interpulse discharge of SIROF electrodes and can inhibit full utilization of their electrochemical charge capacity. This can be corrected by inserting a shunt resistor in the circuit. A shunt resistor does not improve a platinum circuit since its lower charge capacity is completely discharged between the pulses.
The SIROF electrode measurements showed the same linear increase in charge injection per diode, but with a larger, 0.54 mC/cm2 per diode slope. However, this increment is due to the approximately linear increase in current due to the additional voltage available with each additional diode. Unlike platinum where it is the low electrode charge capacity which limits charge injection per diode, the current at the SIROF electrode is limited by the voltage drop in the electrolyte which is effectively linear with current. The SIROF electrode capacity is high enough that in all measurements it is never polarized by more than ~300 mV during a single 0.5-ms pulse. Thus, while measurements were only made for 1–5 series photodiodes, charge injection likely will continue to increase with additional diodes.
Since the SIROF is not polarized to a water electrolysis limit, charge injection can also be enhanced by increasing the pulsewidth. Indeed, during the 0.5-ms pulse, the current only falls by 15% for the largest, voltage-limited pulse [see Fig. 4(f)]. Assuming an exponential current transient (as expected from a zeroth order RC circuit model), the corresponding time constant can be estimated as 0.5 ms/ln(0.85) = 3.1 ms. For the Pt electrode, the corresponding time constant is approximately 0.15 ms. Since electrode charge capacity scales with its area, while the medium resistance is reciprocal to the electrode radius (10), the charging time constant will increase with larger electrodes.
At high pulse repetition rates, the SIROF electrodes are unable to fully discharge during the off phase, as photodiodes are only weakly conductive for voltages below a few hundred millivolts. This incomplete discharge gets worse as stimulation currents increase, as can be seen in Fig. 4(g)—the electrode voltage does not fully return to 0.05 V with respect to the Ag|AgCl reference before the next pulse begins. This effect decreases maximum charge injection, as the electrode can no longer be driven through the full photovoltaically available range if it does not fully discharge. This effect is worse for cathodal stimulation pulses, as the resting potential of SIROF (~ 0.05 V) is closer to the cathodal limit of the water window (−0.6 V) than it is to the anodal limit (0.8 V), and because the charge capacity of SIROF is less at potentials below 0.05 V than at potentials greater than with respect to Ag|AgCl (Fig. 3). Due to this asymmetry, the anodal current injection increases linearly at a rate of 0.54 mC/cm2 for 1–5 diodes, while cathodal current injection remains approximately constant for 2–4 diodes.
3). Shunt Resistor:
Adding a shunt resistor in parallel with the photodiodes can hasten the interpulse recharge, as it increases circuit conductance during the recharge phase [see Fig. 1(c)]. The shunt resistor increases maximum charge injection for 3–5 cathodal photodiodes [see Fig. 6(b)], leading to a linear slope of 0.44 mC/cm2. This is less than the 0.54 mC/cm2 observed for anodal photodiodes simply because of the aforementioned asymmetry of the SIROF charge capacity. While the shunt resistor can increase the maximum charge injection, it also diverts a portion of the photocurrent away from the load and thereby decreases efficiency. A shunt resistor should therefore be avoided when unnecessary, as with platinum systems and anodal stimulation SIROF systems with 1–5 series diodes. When necessary to improve maximum charge injection, the value of the shunt resistance should be carefully chosen to be small enough to ensure full electrical discharge of the electrode, while being relatively large compared to the electrode/retina load to minimize efficiency loss. The 50-kΩ shunt resistor used to make the measurements shown in Fig. 6(b) diverts only a small fraction of the current which drives the 14-kΩ electrode load. Since retinal tissue resistances in vivo can be several times greater than the electrolyte resistances [21], it is likely that a larger shunt resistance will be required in vivo to avoid inefficient stimulation.
4). Photoconductive Charge Injection:
The platinum electrode charges through the full 1.4-V water window for both anodal and cathodal stimulation and, therefore, gives the same 0.38 mC/cm2 charge injection for each. However, for the same 1.4-V voltage, the SIROF electrode does not fully polarize to the opposing water electrolysis limit during the 0.5-ms pulse. The photoconductive charge injection for the SIROF electrode with the same bias voltage is 0.97 mC/cm2 for anodal stimulation and 2.0 mC/cm2 for cathodal stimulation. This asymmetry is due to the lower charge capacity of SIROF when biased at −0.6 V than when biased at 0.8 V (see the cyclic voltammagram in Fig. 3). The resistive current limitation can be compensated by a corresponding increase in the bias voltage VBon With a bias voltage of VBon = 4-V currents as large as 300 μA (corresponding to 7.6 mC/cm2 of charge injection) could be elicited for anodal and cathodal stimulation without fully polarizing the electrode. More current can be provided by these circuits, but 300 μA is the largest which could be achieved given the 500 μW per diode limitation of our illumination system.
V. In-Vitro Subretinal Stimulation
A. Methods
Ganglion cell activation thresholds were measured by placing an explanted rabbit retina between a stimulating photodiode array and a 512-electrode recording array as shown in Fig. 7(b). The artificial silicon retina (ASR) photodiode array used in this experiment was originally fabricated by Optobionics Corporation [1]. It consists of 25-μm square pixels, each containing a central ~ 10 μm stimulating SIROF electrode surrounded by the photosensitive area of a single diode, as shown in Fig. 7(a). All pixels share a single large SIROF return electrode located on the back of the 25-μm-thick ASR, creating an array of single-diode, anodal-stimulation SIROF photodiode circuits.
Fig. 7.

(a) Scanning electron micrograph of a section of the photodiode array (ASR, Optobionics Inc.) (b) The 25-μm photodiodes convert pulsed IR light projected through the retina into electrical current which is delivered to the retina via 10-μm microelectrodes positioned in the center of each photovoltaic pixel. A 512-electrode array facing the ganglion cell layer records their spiking action potentials in response to this stimulation. (c) Peristimulus time histogram of one cell’s responseto IR stimulus shows two stimulated action potentials with 9- and 11-ms latency. Results from 240 stimulation pulses are shown. IR stimulation occurred at time equal zero.
The 512-electrode recording array consists of platinum-black electrodes 5 μm in diameter spaced 60 μm apart on a transparent substrate and has an active area of 0.9 × 1.8 mm2 as described in [28] and [29]. The signals from each electrode were measured through indium tin–oxide tracks formed on top of the glass substrate, and digitized at a 20-kHz sampling rate. The recorded signals were analyzed to extract spikes and then identify spikes from individual neurons using custom-made software [28].
The retinas were explanted from an anesthetized (75-mg/kg ketamine, 5-mg/kg xylazine, 0.01-mg/kg glycopyrolate) Dutch-belt rabbit, which was then immediately euthanized. An approximate 2 × 2-mm section of retina was placed with the ganglion-cell layer facing the recording electrode array and with the photoreceptor layer facing the ASR to facilitate subretinal stimulation. The retina was continuously perfused with Ames solution bubbled with 95% oxygen and 5% carbon dioxide at a flow rate of 2–4 mL/min. An inline heater was used to keep the retina at 30 °C. All experimental procedures were conducted in accordance with institutional guidelines and conformed to the guidelines of the Association for Research in Vision and Ophthalmology (ARVO) Statement for the Use of Animals in Ophthalmic and Vision Research.
Pulses of 905-nm light, 0.5 ms in duration were projected onto the ASR through the transparent recording electrode array and retina at 2 Hz, as shown in Fig. 7(b). Approximately 1 mm2 of the ASR was illuminated. A recorded ganglion cell’s response to IR stimulus was characterized by its peristimulus time histogram.
B. Results
Fig. 7(c) shows the peristimulus histogram of one retinal ganglion cell response to the 2 Hz, 0.5 ms, 1 mW/mm2 IR stimulus. Clear stimulation peaks can be observed at 9 and 11 ms after the stimulus. A comparison of this distribution to the null hypothesis (that the IR pulse has no effect) distribution gives a p value of less than 10−100 using the standard Kolmogrov–Smirnov [30] test. Stimulated spikes for this neuron were observed with a threshold (~50% stimulation efficiency) peak irradiance of 1 mW/mm2 with 0.5-ms pulses. If delivered at 25 Hz, this corresponds to an average irradiance of 0.013 mW/mm2. While the 9–11 ms stimulation latency suggests that the stimulation may be mediated by the bipolar cells, direct ganglion cell stimulation cannot be ruled out. The presence of short, submillisecond latency spikes was impossible to determine with the current setup due to saturation of the recording amplifiers by the stimulation artifact.
The ASR photodiode array produces about 0.3 A/W when illuminated by a homogenous, full-field 905-nm source. The 1-mW/mm2 threshold value therefore corresponds to approximately 0.3 mA/mm2 of stimulating current density during the 0.5-ms pulse, giving a total charge density of 0.15 μC/mm2, or 0.015 mC/cm2. Total charge injection per 25-μm pixel was thus approximately 94 pC/phase, with a charge density of 0.094 mC/cm2 on the ~ 10μm electrode.
A previous in vivo study of implanted ASRs in RCS rats (a common model of retinal degeneration) has demonstrated activation of the superior colliculus in response to IR flashes [14], but did not measure retinal stimulation threshold. It has been observed that retinal load impedance can increase significantly post-implantation [21], and electrical stimulation thresholds may be higher for degenerated retinas. It is therefore possible that more light power will be required in vivo than in vitro. However, it is nevertheless clear that in both cases, photovoltaic retinal stimulation is possible with even single photodiode circuits. The multidiode circuits analyzed in this paper can provide additional charge injection for increased pixel densities and enhanced dynamic range of stimulation.
VI. Implications for Optoelectronic Prosthesis Design
A. Charge Delivery
The current-limited pulses at lower light intensities provide linear conversion of light into current. This linearity facilitates information transfer, as modulating the incident light results in the same modulation of the stimulation current. Between 60% and 90% (depending on the specific circuit) of the charge injection limit may be delivered in this linear manner. The upper range of light intensities exhibits much lower and nonlinear light-to-current conversion, corresponding to voltage-limited circuit operation.
Since counter electrodes in these measurements had areas more than two orders of magnitude larger than the area of the active electrode, the counter electrode potentials moved very little during the stimulation electrode polarization. In an actual prosthesis, the counter electrodes are likely to be smaller, and a larger fraction of the voltage will be lost due to the counter electrode depolarization, thereby yielding slightly reduced charge-injection limits.
B. Safety Considerations
1). Compliance Supply-Limited Pulses:
Compliance supply-limited current sources have been proposed as a practical way of ensuring that electrode polarizations remain within a safe operating range [31], [32]. Photodiode systems provide such current sources. They produce current pulses until the available voltage swing has been exhausted, at which point the pulse becomes voltage limited. In practice, however, in vivo tissue impedances are considerably larger than impedances in saline, and can therefore require voltages larger than 1.4 V to fully compensate for significant resistive losses across the tissue [21]. While past in vivo experiments in blind rats indicate that even single-diode photovoltaic implants driven by an IR flash can induce retinal stimulation [14], the maximum voltage available determines the maximum current and dynamic range. In photoconductive systems, the bias may be tuned to provide any desired limiting voltage. In photovoltaic systems, voltage may be increased by adding more photodiodes in series.
2). Optical Safety:
According to established safety standards [33], [34], the maximum permissible radiant power (MPΦ), which may be delivered to the retina for prolonged exposures, is
| (12) |
where CT is a wavelength-dependent parameter given by 100.002(λ–700) in the 700–1050 nm range, taking the values of 2.5 at λ = 905 nm. CE accounts for the angular spread in the incident beam and for retinal spot sizes greater than 1.7 mm in diameter, it is given by 29.3 W/mm2. P is the pupil factor which takes into account pupil constriction in response to the beam or drug-induced dilation, and is exactly 1 for invisible IR wavelengths in the absence of dilating drugs. Taken together, these values give a maximum permissible exposure of 2.8–8 mW/mm2 for chronic retinal prosthesis illumination in the 775–1000 nm wavelength range. For the 905-nm wavelength used for the measurements in this study, the limit is 5.2 mW/mm2. These are limits of average retinal irradiance, not peak irradiance. As for single-pulse exposure, the peak-irradiance limit in the 0.05 –70 ms range of durations is described by the equation [33], [34]
| (13) |
For a pulse duration of 0.5 ms, the limit is 350 mW/mm2.
With a pulse duration τ and a repetition rate of f pulses per second, the corresponding peak irradiance is Epeak = Eavg/(τ·f). This limits the maximum current injection to Epeak · a · α mA/mm2, where a is the fraction of the photosensitive area and α is the photodiode responsivity [A/W]. With m photodiodes connected in series, the light-to-current conversion per unit area is reduced by a factor of m since the light must be divided among m photodiodes. The corresponding maximum average charge density per phase is then Epeakτ · a · α/m = Eavg · a · α/(m · f) mC/mm2. In terms of charge per pixel (in units of mC), this corresponds to
| (14) |
where ρ is the pixel density [pixels/mm2] and Eavg is taken at its most conservative value, 2.8 mW/mm2. Note that this function is independent of pulsewidth since the charge injection and the average light power are proportional to pulse duration.
Partially collimated IR illumination may be delivered to the retina through the cornea, pupil, and lens, which are mostly transparent at these wavelengths. However, eye movements may result in some or all of this light landing on the iris, where similar thermal heating considerations apply. Since a dark-adapted pupil has a diameter of at least 3 mm, a retinal spot 2–3 mm in diameter (corresponding to the typical size of retinal pros-theses) may be projected without beam irradiance at the iris plane exceeding the retinal irradiance, thereby posing no additional danger. Indeed, a comparable amount of sunlight (~ 1 mW/mm2) falls on the iris on a sunny day, light which leads to greater tissue heating because melanin is significantly more absorptive at visible than IR wavelengths [35]. A near-to-eye projection system capable of safely delivering this bright IR image to a 3-mm spot on the retina has previously been described [12]. Such a system uses light collimated to within 8–10° of divergence to create retinal illumination spots that are 2 to 3 mm in diameter. Larger beam divergences are possible to create larger spots, if necessary.
C. Maximum Charge Injection
1). SIROF:
Charge injection is also limited electrochemically. For photovoltaic SIROF-electrode implants, Fig. 6(b) demonstrates a linear relationship between maximum charge injection per unit area qinj and the number of photodiodes
| (15) |
where in this study we have measured q0 = 0.5 mC/cm2 = 0.005 mC/mm2 for the 0.5-ms pulse. Thus
| (16) |
where b is the fraction of pixel area covered by the stimulating electrode, q0 is the charge injection per diode [mC/mm2 per pixel], and where ρ and m are as defined above. This is an increasing function of m, while the optically attainable charge injection (14) is a decreasing function of m; the optimal design will be at the intersection of these two functions, calculated as
| (17) |
which must be rounded to an integer to be physically meaningful. For f = 25-Hz stimulation with a = 0.4 photosensitive area fill factor, b = 0.15 electrode fill factor, α = 0.6-A/W responsivity, and q0 = 0.005 mC/mm2, we calculate moptimum ≈ 6 photodiodes.
Using this value of m with (14), we can plot Qinj as a function of pixel density, as shown in Fig. 8. Since in-vivo retinal resistivity is generally ~ 5 times higher than in vitro saline measurements [21], the current and the associated charge injection per photodiode will likely decrease by the same amount, to approximately q0 = 0.001 mC/mm2. In this case, the optimal number of diodes increases to 13 to overcome the greater resistance.
Fig. 8.

Charge injection per pixel as a function of pixel density, with SIROF electrodes. Charge injection per area is constant along these contours, with the values shown. Photovoltaic contours are plotted for q0 = 0.5 mC/cm2 per pixel (the value measured in this study) and for q0 = 0.1 mC/cm2 per pixel, which corrects for the roughly ~ 5x increase in in vivo resistances [21]. Six diodes is optimal for q0 = 0.5 mC/cm2 and 13 diodes is optimal for a prosthesis with q0 = 0.1 mC/cm2. Three-diode pixels are currently manufactured for photovoltaic implants [37]. Photoconductive pixels offer the highest charge injections (7.6 mC/cm2), but require an external bias.
This calculation does not take into account that the photosensitive area likely decreases with the number of diodes faster than linearly due to the fixed width of the nonphotosensitive circuit features, such as insulation gaps between diodes, conducting leads, etc. Therefore, the optimal number of diodes per pixel will be somewhat smaller than this estimate, with the exact number depending on fabrication details. In addition, some electrodes in the implanted photodiode array will face lower resistance due to variation in the distance between electrodes and retinal neurons, and may polarize to a larger extent than the ones in a more resistive environment. To avoid overpolarization and the associated electrode damage, the number of diodes per pixel should be limited, assuming the lowest possible resistance. Human perceptual thresholds have been reported to be in the 0.3 –2.4 V range for 50-μm electrodes [36]. These voltages can be produced by five photodiodes in series.
Currently, three is the highest number of diodes per pixel reported in the literature [37], so in each case, contours for three-diode pixels are also shown in Fig. 8. For comparison, the measured lower bound of 7.6 mC/cm2 for electrochemically safe charge injection from a photoconductive SIROF implant is also plotted. Assuming the same values of a, b, α, and f, this level of charge injection can be delivered at light intensity a factor of two below the optical safety limit [see (14) and (16)].
2). Platinum:
As discussed in Section IV-B, three or four photodiodes are sufficient to fully polarize a photovoltaically driven platinum electrode through the full width of the water window, and larger numbers of diodes cannot increase charge injection. The maximum charge injection is approximately 0.11 mC/cm2 for cathodal photovoltaic stimulation, 0.14 mC/cm2 for anodal photovoltaic stimulation, and 0.38 mC/cm2 for photoconductive stimulation, all values which can be easily driven through four diodes (for the photovoltaic circuits) or 1 diode (for the photoconductive circuits) with light intensities much less than the 2.8 mW/mm2 optical safety limit. The limit with a platinum electrode is clearly electrochemical. This charge injection is likely to remain the same in vivo, since it is limited by platinum’s relatively small charge capacity, not by the resistance of the electrode load.
D. Charge Injection versus Stimulation Thresholds
1). Charge Density:
Our measurements on the ASR device indicate a stimulation threshold of 0.094 mC/cm2 on the stimulating electrodes. This is less than the ~ 1 mC/cm2 thresholds reported for subretinal stimulation of rabbit retina using a single 25-μm electrode [38], but greater than the 0.001–0.05 mC/cm2 reported for 100 μm and larger electrodes [39]–[41]. This midrange threshold value between the extremes of stimulation with a single small electrode and a single large electrode is consistent with the fact that stimulation was produced by simultaneous activation of hundreds of small, 10-μm electrodes distributed over a ~ 1 mm2 area with a low (~15%) electrode area fill factor.
Equation (15) indicates a charge injection of q0 = 0.5 mC/cm2 per diode with SIROF electrodes, so that a one-diode circuit provides a 5x dynamic range, two diodes provide a 10x dynamic range, three provide 15x, etc. However, as discussed previously, the increase in retinal impedance after implantation may decrease q0 to 0.1 mC/cm2 per diode, so in practice m diodes may give a dynamic range of a little more than m times the 0.094 mC/cm2 stimulation threshold.
The data indicate that at least three diodes per pixel are required for photovoltaic stimulation with platinum electrodes. Photoconductive platinum electrode systems are able to deliver charge densities sufficient for stimulation (0.38 mC/cm2), with a maximum dynamic range of about 4x.
2). Charge per Phase:
The approximate 94 pC/phase stimulation threshold measured in this study was for activation of every pixel at once; single-pixel stimulation thresholds will likely be higher, as can be seen in the literature. Though there have been several studies of retinal stimulation thresholds in humans, most have used relatively large stimulation electrodes, with diameters exceeding 100 μm. For smaller electrodes, studies in various animal models suggest a neural activation threshold in the range of 1–9 nC/phase for subretinal [39], [41], [42] and 0.02–0.3 nC/phase for epiretinal [43]–[45] stimulation. The position of the highest of these thresholds (9 nC) on the lowest of the curves plotted in Fig. 8 (three diodes with the lower charge injection expected in vivo) indicates a worst-case scenario maximum pixel density of ~ 50 pixels/mm2. However, a dynamic range of stimulation significantly above threshold would be ideal; a pixel density of ~ 25 pixels/mm2 could provide 18 nC of charge injection (twice the worst-case stimulation threshold). For lower stimulation thresholds and/or more optimal systems, these photodiode circuits can support hundreds of pixels/mm2 with this dynamic range.
VII. Conclusion
The performance of various photoconductive and photovoltaic optical circuits has been characterized using platinum and SIROF microelectrodes. The use of series photodiodes greatly enhances the charge injection of a photovoltaic circuit, and makes them potentially suitable for retinal stimulation. Video rate charge injection can be further increased by including a shunt resistor in parallel with the series photodiodes. While photoconductive systems have the highest charge injection, they require an active bias voltage. The absence of an additional power supply in a photovoltaic system can greatly simplify prosthesis design, fabrication, and the associated surgical procedures. While we have verified that successful photovoltaic stimulation of the retina is possible, future studies are required to determine the responses of the various retinal neurons to such stimulation.
Acknowledgment
The authors would like to thank T. Kamins for assistance in measuring and interpreting diode voltage-current sweeps, A. Vankov for helpful discussions and advice on circuit design, and the reviewers who volunteered their expertise to help improve the presentation. We would also like to thank Dr. J. Rizzo of the Center for Innovative Vision Research at the Boston VA Hospital for providing the SIROF microelectrode arrays used in this study.
This work was supported in part by the Air Force Office of Scientific Research, in part by the National Science Foundation Graduate Research Fellowship Program, in part by a Stanford University Bio-X Research Grant, in part by a National Institutes of Health Grant R01 EY018608, in part by the Burroughs Wellcome Fund Career Award at the Scientific Interface, and in part by the RCUK SU2P Science Bridges Award. The SIROF microelectrodes were provided by Joseph Rizzo at the Center for Innovative Vision Research at the Boston VA Hospital (Department of Veterans Affairs, Rehabilitation Research and Development Service under Grant no. C4266-C). This paper was recommended by Associate Editor T. Delbruck.
Biographies

James D Loudin received the B.S. degree in physics, the B.S.E.E. degree in electrical engineering, and the B.A. degree in mathematics from Rice University, Houston, TX, in 2005 and the Ph.D. degree in applied physics from Stanford University, Stanford, CA, in 2010.
Currently, he is a Postdoctoral Scholar at Stanford University, Stanford, CA. His research interests include the development of novel implantable neurostimulators.
In 2006, he received the National Science Foundation Graduate Research Fellowship.

Stuart F. Cogan received the B.Sc. degree in mechanical engineering and the M.S. degree in materials science from Duke University, Durham, NC, in 1975 and 1977, respectively, and the D.Sc. degree in materials science from the Massachusetts Institute of Technology, Cambridge, in 1979.
Currently, he is Director of Advanced Materials Research at EIC Laboratories, Inc., Norwood, MA. His research interests included thin-film electrochromics for optical switching devices, materials for encapsulating implanted medical devices, and electrode materials for stimulation and recording in prosthetic and pacing applications. He is presently working on electrodes for retinal prostheses, vision prostheses using intracortical stimulation, cardiac pacing and defibrillation, and on neurotrophin releasing polymers for intracortical recording electrodes.
Keith Mathieson received the Ph.D. degree in physics from the University of Glasgow, Glasgow, U.K., on semiconductor pixel detectors in 2001.
Since then, he has developed high-density microelectrode arrays to study the response of retinal tissue to optical and electrical stimulation in collaboration with the University of California Santa Cruz; the Salk Institute for Biological Studies, San Diego; and Stanford University, Stanford, CA.
Dr. Mathieson is the recipient of a Scottish Government/Royal Society of Edinburgh personal research fellowship and an SU2P entrepreneurial fellowship funded through RCUK.

Alexander Sher received the Ph.D. degree in physics from the University of Pittsburgh, Pittsburgh, PA, in 2002.
Currently, he is an Assistant Professor at the Santa Cruz Institute for Particle Physics, University of California, Santa Cruz. His research is concerned with developing experimental techniques for large-scale recording and stimulation of neural activity as well as using these techniques to study function, development, and treatment of mammalian visual systems.

Daniel V. Palanker received the Ph.D. degree in applied physics from the Hebrew University of Jerusalem, Israel, in 1994.
Currently, he is an Associate Professor in the Department of Ophthalmology and in Hansen Experimental Physics Laboratory, Stanford University, Stanford, CA. He studies interactions of the electric field and light with biological cells and tissues, and develops their diagnostic, therapeutic, and prosthetic applications. Two of his inventions: pattern scanning laser photocoagulator and pulsed electron avalanche knife are clinically used worldwide, and the Femtosecond Laser System for Cataract Surgery is currently awaiting FDA approval. His research in therapeutic applications includes multiphoton interactions with transparent biological tissues, cellular response to transient hyperthermia, and pulsed plasma-mediated electrosurgery. In the field of prosthetics, he is working on the development of a high-resolution optoelectronic retinal prosthesis to restore sight for patients blinded by retinal degeneration.
Contributor Information
James D. Loudin, Department of Applied Physics, Stanford University, Stanford, CA 94305 USA
Stuart F. Cogan, EIC Laboratories, Norwood, MA 02062 USA
Keith Mathieson, Department of Physics and Astronomy, University of Glasgow, Glasgow G12 8QQ, U.K. He is also with the Hansen Experiment Physics Laboratory, Stanford University, Stanford, CA 94305 USA.
Alexander Sher, Santa Cruz Institute for Particle Physics, University of California at Santa Cruz, Santa Cruz, CA 95064 USA.
Daniel V. Palanker, Department of Ophthalmology and Hansen Experiment Physics Laboratory, Stanford University, Stanford, CA 94305 USA
References
- [1].Chow A, Chow V, Packo K, Pollack J, Peyman G, and Schuchard R, “The artificial silicon retina microchip for the treatment of vision loss from retinitis pigmentosa,” Arch Ophthalmol, vol. 122, pp. 460–469, 2004. [DOI] [PubMed] [Google Scholar]
- [2].Stelzle M, Stett A, Brunner B, Graf M, and Nisch W, “Electrical properties of micro-photodiode arrays for use as artificial retina implant,” Biomed. Microdevices, vol. 3, pp. 133–142, 2001. [Google Scholar]
- [3].Zrenner E, Bartz-Schmidt KU, Benav H, Besch D, Bruckmann A, Gabel VP, Gekeler F, Greppmaier U, Harscher A, Kibbel S, Koch J, Kusnyerik A, Peters T, Stingl K, Sachs H, Stett A, Szurman P, Wilhelm B, and Wilke R, “Subretinal electronic chips allow blind patients to read letters and combine them to words,” in Proc. Roy. Soc. B, Nov. 3, 2010. [DOI] [PMC free article] [PubMed] [Google Scholar]
- [4].Besch D, Sachs H, Szurman P, Gulicher D, Wilke R, Reinert S, Zrenner E, Bartz-Schmidt KU, and Gekeler F, “Extraocular surgery for implantation of an active subretinal visual prosthesis with external connections: Feasibility and outcome in seven patients,” British J. Ophthalmol, vol. 92, pp. 1361–1368, 2008. [DOI] [PubMed] [Google Scholar]
- [5].Rizzo J, Wyatt J, Loewenstein J, Kelly S, and Shire D, “Methods and perceptual thresholds for short-term electrical stimulation of human retina with microelectrode arrays,” Investig.Ophthalmol. Vis. Sci, vol. 44, pp. 5355–5361, 2003. [DOI] [PubMed] [Google Scholar]
- [6].VeraartM C.Wanet-Defalque B Gerard A Vanlierde, and Delbeke J, “Pattern recognition with the optic nerve visual prosthesis,” Artif. Organs, vol. 27, pp. 996–1004, 2003. [DOI] [PubMed] [Google Scholar]
- [7].Knutson J, Naples G, Peckham P, and Keith M, “Electrode fracture rates and occurences of infection and granuloma associated with percutaneous intramuscular electrodes in upper-limb functional electrical stimulation applications,” J. Rehabil. Res. Develop, vol. 39, pp. 671–684, 2002. [PubMed] [Google Scholar]
- [8].Liu W, Vichienchom K, Clements M, DeMarco S, Hughes C, McGucken E, Humayun M, De Juan E, Weiland JD, and Greenberg R, “A neuro-stimulus chip with telemetry unit for retinal prosthesis device,” IEEE Solid-State Circuits, vol. 35, no. 10, pp. 1487–1497, Oct. 2000. [Google Scholar]
- [9].Theogarajan L, Wyatt J, Rizzo J, Drohan B, Markova M, Kelly S,Swider G,Raj M, Shire D, Gingerich G, Lowenstein L, and Yomtov B, “Minimally invasive retinal prosthesis,” in Proc. IEEE Int. Solid-State Circuits Conf, 2006, pp. 54–55. [Google Scholar]
- [10].Wickelgren I, “A vision for the blind,” Science, vol. 312, pp. 1124–1126, 2006. [DOI] [PubMed] [Google Scholar]
- [11].Zrenner E, “The subretinal implant: Can microphotodiode arrays replace degenerated retinal photoreceptors to restore vision?,” Ophthalmologica, vol. 216, no. Suppl 1, pp. 8–20, 2002. [DOI] [PubMed] [Google Scholar]
- [12].Loudin JD, Simanovskii DM, Vijayraghavan K, Sramek CK, Butterwick AF, Huie P, McLean GY, and Palanker DV, “Optoelectronic retinal prosthesis: System design and performance,” J. Neural Eng, vol. 4, pp. S72-84–S72-84, 2007. [DOI] [PubMed] [Google Scholar]
- [13].Palanker D, Vankov A, Huie P, and Baccus S, “Design of a high-resolution optoelectronic retinal prosthesis,” J. Neural Eng, vol. 2, pp. S105-20–S105-20, 2005. [DOI] [PubMed] [Google Scholar]
- [14].DeMarco P, Yarbrough G, Yee C, McLean GY, Sagdullaev B, Ball S, and McCall M, “Stimulation via a subretinally placed prosthetic elicits central activity and induces a trophic effect on visual responses,” Investig. Ophthalmol. Vis. Sci, vol. 48, pp. 916–926, 2007. [DOI] [PubMed] [Google Scholar]
- [15].Banerjee RK, Zhu L, Gopalakrishnan P, and Kazmierczak MJ, “Influence of laser parameters on selective retinal treatment using single-phase heat transfer analyses,” Med. Phys, vol. 34, pp. 1828–1841, 2007. [DOI] [PubMed] [Google Scholar]
- [16].Booth KM and Hill SL, The Essence of Optoelectronics. London, U.K.: Prentice-Hall, 1998. [Google Scholar]
- [17].Hess K, Advanced Theory of Semiconductor Devices, 1st ed. Hoboken, NJ: Wiley/IEEE, 2009. [Google Scholar]
- [18].Corless RM, Gonnet GH, Hare DEG, Jeffrey DJ, and Knuth DE, “On the Lambert function,” Advances in Computational Mathematics, vol. 5, pp. 329–359, 1996. [Google Scholar]
- [19].Beebe X and Rose T, “Charge injection limits of activated iridium oxide electrodes with 0.2 ms pulses in bicarbonate buffered saline (neurological stimulation application),” IEEE Trans. Biomed. Eng, vol. 35, no. 6, pp. 494–495, Jun. 1988. [DOI] [PubMed] [Google Scholar]
- [20].Cogan S, Troyk PR, Ehrlich J, Plante TD, and Detlefsen DE, “Potential-Biased, asymmetric waveforms for charge-injection with activated iridium oxide (AIROF) neural stimulation electrodes,” IEEE Trans Biomed .Eng, vol. 53, no. 2, pp. 327–332, Feb. 2006. [DOI] [PubMed] [Google Scholar]
- [21].Cogan SF, “In vivo and in vitro differences in the charge-injection and electrochemical properties of iridium oxide electrodes,” in Proc. IEEE Annu. Int. Conf. Eng. Med. Biol. Soc., 2006, vol. 1, pp. 882–885. [DOI] [PubMed] [Google Scholar]
- [22].Cogan SF, Troyk PR, Ehrlich J, Gasbarro CM, and Plante TD, “The influence of electrolyte composition on the in vitro charge-injection limits of activated iridium oxide (AIROF) stimulation electrodes,” J. Neural Eng, vol. 4, pp. 79–86, 2007. [DOI] [PubMed] [Google Scholar]
- [23].Negi S, Bhandari R, Rieth L, Van Wagenen R, and Solzbacher F, “Neural electrode degradation from continuous electrical stimulation: Comparison of sputtered and activated iridium oxide,” J. Neurosci. Meth, vol. 186, pp. 8–17, Jan. 2010. [DOI] [PMC free article] [PubMed] [Google Scholar]
- [24].Slavcheva E, Vitushinsky R, Mokwa W, and Schnakenberg U, “Sputtered iridium oxide films as charge injection material for functional electrostimulation,” J. Electrochem. Soc, vol. 151, pp. E226–E237, 2004. [Google Scholar]
- [25].Newman J, “Resistance for flow of current to a disk,” J. Electrochem. Soc, vol. 113, pp. 501–&, 1966. [Google Scholar]
- [26].Cogan S, “Sputtered iridium oxide films (SIROFs) for low-impedance neural stimulation and recording electrodes,” in Proc. IEEE 26th Annu. Int. Conf. EMBS, San Francisco, CA, 2004, pp. 4153–4156. [DOI] [PMC free article] [PubMed] [Google Scholar]
- [27].Negi S, Bhandari R, Rieth L, and Solzbacher F, “In vitro comparison of sputtered iridium oxide and platinum-coated neural implantable microelectrode arrays,” Biomed.Mater., vol. 5, 2010. [DOI] [PubMed] [Google Scholar]
- [28].Litke AM, Bezayiff N, Chichilnisky EJ, Cunningham W, Dabrowski W, Grillo AA, Grivich M, Grybos P, Hottowy P, Kachiguine S, Kalmar RS, Mathieson K, Petrusca D, Rahman A, and Sher A, “What does the eye tell the brain?: Development of a system for the large-scale recording of retinal output activity,” IEEE Trans. Nucl. Sci, vol. 51, no. 4, pp. 1434–1440, Aug. 2004. [Google Scholar]
- [29].Mathieson K, Kachiguine S, Adams C, Cunningham W, Gunning D, O’Shea V, Smith KM, Chichilnisky EJ, Litke AM, Sher A, and Rahman M, “Large-area microelectrode arrays for recording of neural signals,” IEEE Trans. Nucl. Sci, vol. 51, no. 5, pp. 2027–2031, Oct. 2004. [Google Scholar]
- [30].Eadie WT, Drijard D, James FE, Roos M, Sadoulet B, and , Statistical Methods in Experimental Physics. Amsterdam, The Netherlands: North-Holland, 1971. [Google Scholar]
- [31].Hu Z, Troyk PR, Brawn TP, Margoliash D, and Cogan SF, “In vitro and in vivo charge capacity of AIROF microelectrodes,” in Proc. IEEE Conf. Annu. Int. Conf. Eng. Med. Biol. Soc, 2006, vol. 1, pp. 886–889. [DOI] [PubMed] [Google Scholar]
- [32].Troyk P, Cogan S, and DeMichele G, “Compliance supply-limited driving of iridium oxide (AIROF) electrodes for maintenance in a safe operating region,” presented at the 10th Annu. Conf. Int. FES Soc., Montreal, QC, Canada, 2005. [Google Scholar]
- [33].American National Standard for safe use of lasers (ANSI 136.1), ANSI 136.1-2000, ANSI, The Laser Institute of America, 2000. [Google Scholar]
- [34].DeLori F, Webb R, and Sliney D, “Maximum permissable exposures for ocular safety (ANSI 2000), with emphasis on ophthalmic devices,” J. Opt. Soc. Amer. A, vol. 24, pp. 1250–1265, May 2007. [DOI] [PubMed] [Google Scholar]
- [35].Kollias N, “The spectroscopy of human melanin pigmentation,” in Melanin: Its Role in Human Photoprotection. Overland Park, KS: Valdenmar, 1995, pp. 31–38. [Google Scholar]
- [36].Zrenner E, “Subretinal implants allow blind RP-patients to read letters and combine them to words at once without training,” presented at the Eye and The Chip World Congr Artif. Vis., Detroit, MI, 2010. [Google Scholar]
- [37].Loudin J, Dinyari R, Huie P, Butterwick A, Peumans P, and Palanker D, “High resolution photovoltaic retinal prosthesis,” presented at the SPIE Ophthalmic Technologies XIX Conf., San Jose, CA, 2009. [Google Scholar]
- [38].Tsai D, Morley JW, Suaning GJ, and Lovell NH, “Direct activation and temporal response properties of rabbit retinal ganglion cells following subretinal stimulation,” J. Neurophysiol, vol. 102, pp. 2982–2993, Nov. 2009. [DOI] [PubMed] [Google Scholar]
- [39].Gekeler F, Kobuch K, Schwahn HN, Stett A, Shinoda K, and Zrenner E, “Subretinal electrical stimulation of the rabbit retina with acutely implanted electrode arrays,” Graefes Archive Clin. Exp. Ophthalmol, vol. 242, pp. 587–596, 2004. [DOI] [PubMed] [Google Scholar]
- [40].Jensen RJ and Rizzo JF, “Comparison of electrically evoked cortical potential thresholds generated with subretinal or suprachoroidal placement of a microelectrode array in the rabbit,” Exp. Eye Res, vol. 83, pp. 367–373, Aug. 2006. [DOI] [PubMed] [Google Scholar]
- [41].Yamauchi Y, Franco LM, Jackson DJ, Naber JF, Ziv RO, Rizzo JF, Kaplan HJ, and Enzmann V, “Comparison of electrically evoked cortical potential thresholds generated with subretinal or suprachoroidal placement of a microelectrode array in the rabbit,” J. Neural Eng, vol. 2, pp. S48-56–S48-56, 2005. [DOI] [PubMed] [Google Scholar]
- [42].Stett A, Barth W, Weiss S, Haemmerle H, and Zrenner E, “Electrical multisite stimulation of the isolated chicken retina,” Vis. Res, vol. 40, pp. 1785–1795, 2000. [DOI] [PubMed] [Google Scholar]
- [43].Sekirnjak C, Hottowy P, Sher A, Dabrowski W, Litke AM, and Chichilnisky EJ, “Electrical stimulation of mammalian retinal ganglion cells with multielectrode arrays,” J. Neurophysiol, vol. 95, pp. 3311–3327, Jun. 2006. [DOI] [PubMed] [Google Scholar]
- [44].Sekirnjak C, Hottowy P,Sher A,Dabrowski W, Litke AM, and Chichilnisky EJ, “High-resolution electrical stimulation of primate retina for epiretinal implant design,” J. Neurosci, vol. 28, pp. 4446–4456, 2008. [DOI] [PMC free article] [PubMed] [Google Scholar]
- [45].Jensen RJ, Rizzo JF, Ziv OR, Grumet A, and Wyatt J, “Thresholds for activation of rabbit retinal, ganglion cells with an ultrafine, extracellular microelectrode,” Invest. Ophthalmol. Vis. Sci, vol. 44, pp. 3533–3543, Aug. 2003. [DOI] [PubMed] [Google Scholar]