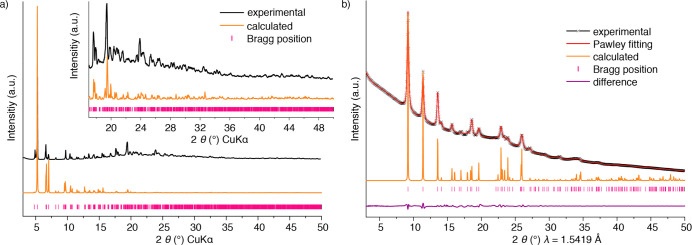
Figure 3.
Representation of PXRD patterns for MOFs and COFs. Comparison between the experimental and simulated patterns of MOF-520 (a).65 Because of the large difference in relative intensities in different 2θ regions, a blown up area is required. A synchrotron collected (wavelength indicated) PXRD pattern of COF-112 (b).66 In this case, a Pawley refinement can be made, since there are enough experimentally observed reflections. The nature of the refinement is indicated in the figure legend, and the image includes the calculated pattern for the corresponding model, for visual comparison of the expected relative intensities.

