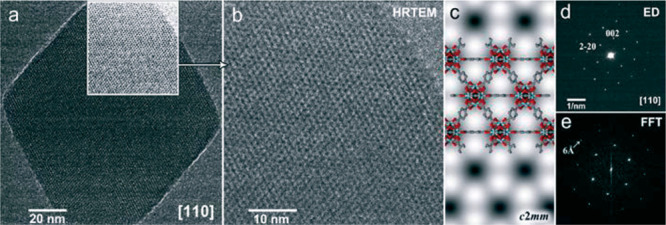
Figure 5.

Exemplary display of TEM imaging data of a reticular structure, UiO-66. The transmission image of the selected crystal (a) is accompanied by a further magnifications (b–c) of an highlighted area of (a), the diffraction pattern of the entire crystal with indexed reflections (d), and the FFT (e) of the high-resolution image shown in (b). Reproduced from ref (79) with permission from the Royal Society of Chemistry.79
