Figure 3.

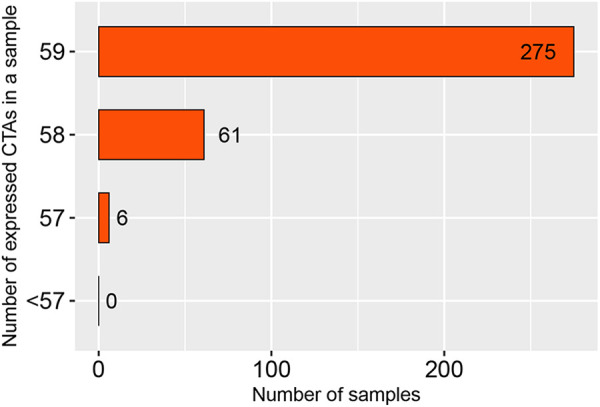
Coexpression analysis of 59 cancer-testis (CT) genes in hepatocellular carcinoma (HCC). Y-axis: the number of CT genes coexpressed in a HCC tumor sample. X-axis: the number of tumor samples.

Coexpression analysis of 59 cancer-testis (CT) genes in hepatocellular carcinoma (HCC). Y-axis: the number of CT genes coexpressed in a HCC tumor sample. X-axis: the number of tumor samples.