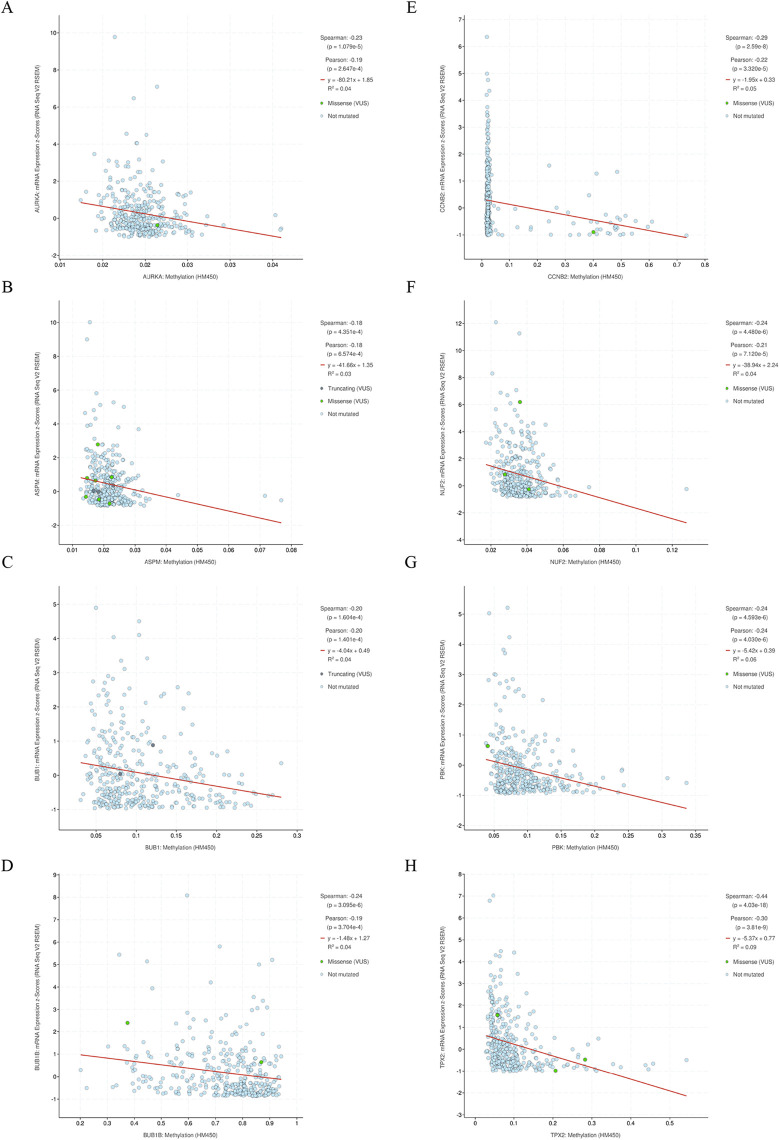
Figure 6.
Correlation between methylation levels and cancer-testis (CT) gene expression. Promoter methylation and gene expression data from The Cancer Genome Atlas (TCGA) were visualized using cBioPortal to demonstrate the correlation among selected hub CT genes, and significant negative relationship was identified in: (A) ARUKA, (B) ASPM, (C) BUB1, (D) BUB1B, (E) CCNB2, (F) NUF2, (G) PBK, (H) TPX2.

