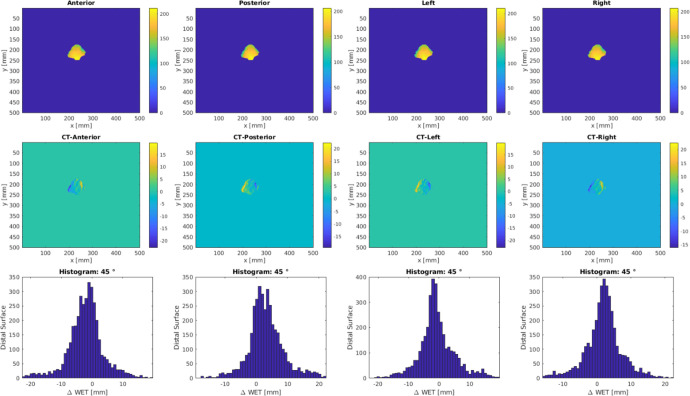
Figure 3.
Example output of ΔWET analysis for beam angle at 45°. Top row is the BEV WET matrix at the distal edge of the ITV for various CT shifts. The ΔWET matrix, as shown in the second row, is calculated from the difference between the planning CT and shifted CTs. Histograms are shown in the third row for ΔWET visual assess per field.

