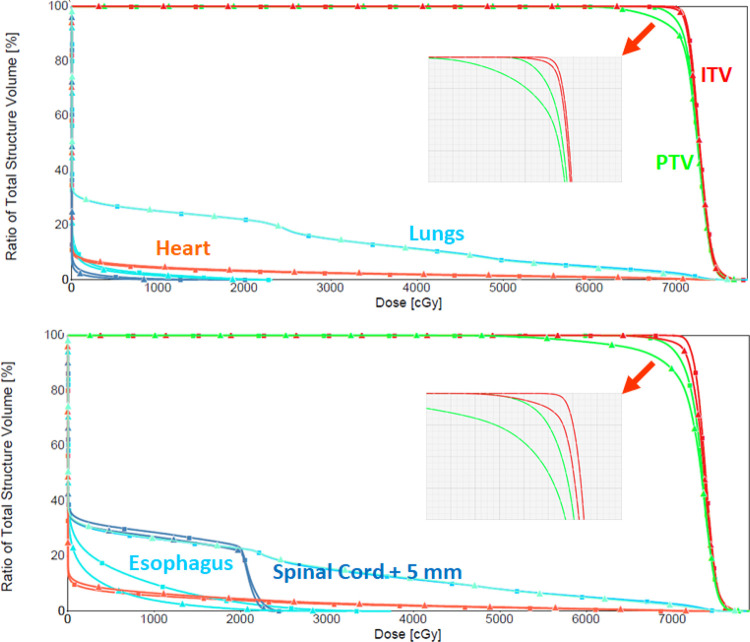
Figure 7.
For the example patient showed in Figure 6, this figure shows the ΔWET-guided plan (top) DVH curves before and after the shift. DVH curves from the original plan (bottom) before and after the shift from the original clinical plan are shown for comparison.

