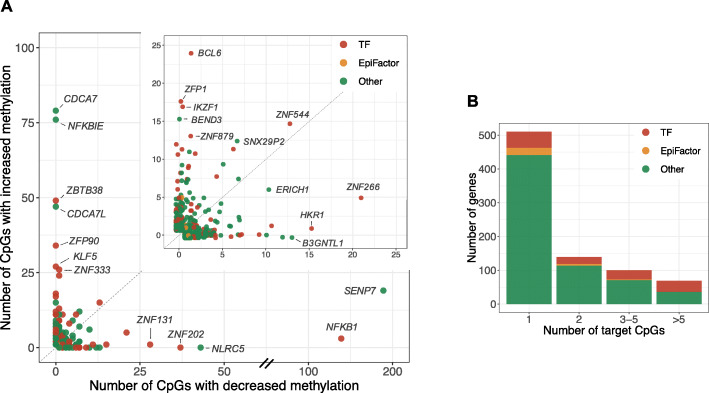
Fig. 2.
A considerable fraction of the identified genes (N = 308) affected multiple target CpGs in trans. a Each dot represents a gene with trans DNA methylation effects. The x-axis shows the number of affected target CpGs with decreased methylation levels upon increased gene expression, and the y-axis shows the number of affected target CpGs with increased methylation levels upon increased gene expression. The figure in the right upper corner is a zoomed-in version in which only genes that affect less than 25 CpG sites in either direction are displayed. b Bars represent the number of genes with either 1, 2, 3–5, or more than 5 target CpGs. The percentage of genes that are annotated as transcription factors increases with the number of target CpGs

