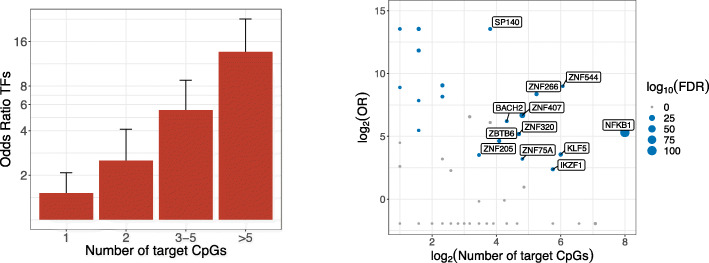
Fig. 3.
a Enrichment (odds ratio) for transcription factors among identified genes with either 1, 2, 3–5, or more than 5 target CpGs. Error bars represent 95% confidence intervals. b Transcription factor binding site enrichment; each dot represents a transcription factor, with on the x-axis the logarithm of the number of target CpGs for that transcription factor (at a gene-level significance level; P < 1.2 × 10⁻⁷), and on the y-axis the odds ratio for the enrichment of the target CpGs in its experimentally determined binding sites (ChIP-seq). The size of the dots represents the significance (FDR), and TFs for which the target CpGs were significantly enriched in its binding sites are colored in blue

