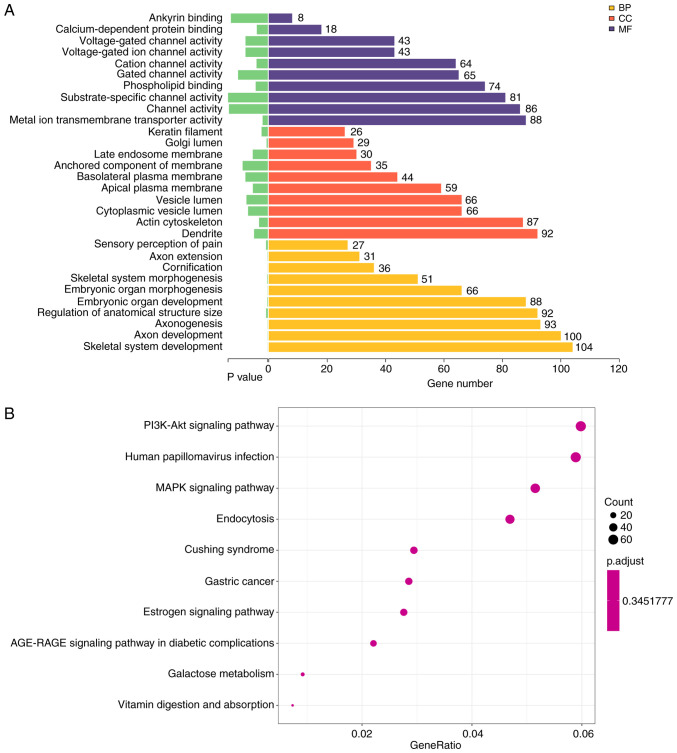
Figure 2.
Bioinformatics analysis of the sequencing data. (A) GO enrichment analysis of BPs, CCs and MFs. P-values and the number of genes under each term are shown on the x-axis. GO term descriptions are presented along the y-axis. (B) Bubble graph of Kyoto Encyclopedia of Genes and Genomes enrichment results. The gene ratio of each pathway is indicated on the x-axis. Number of genes involved in each pathway proportional to the size of the bubbles. The color of the bubbles represent the P-values. GO, Gene Ontology; CC, cellular component; BP, biological process; MF, molecular function.

