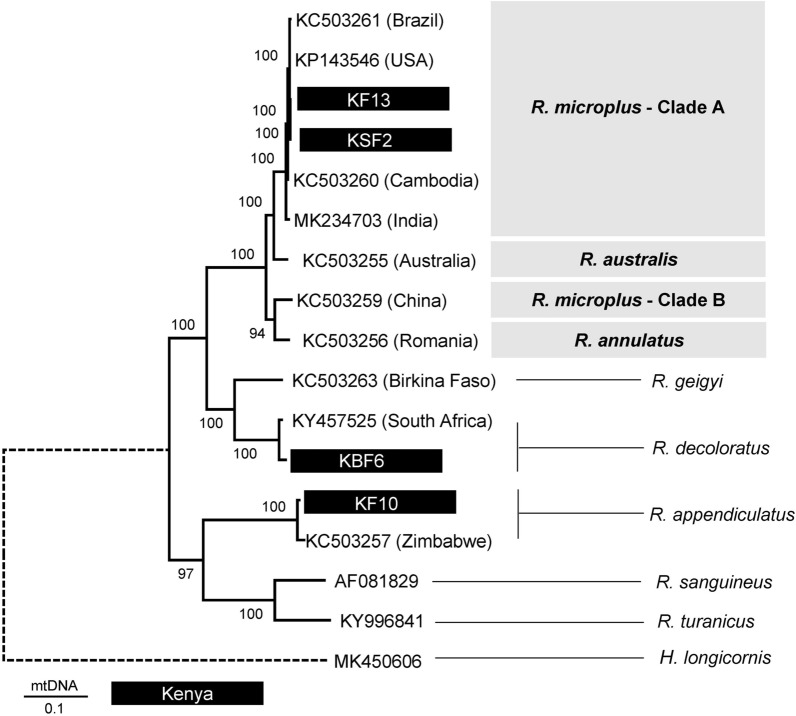
Fig. 8.
Maximum Likelihood (ML) mtDNA tree inferred from 17 nucleotide sequences. The analysed sequences included four mitochondrial genomes sequenced in this study (highlighted) and annotated reference genomes available on GenBank. The four mtDNA genomes analysed in this study were: R. microplus KF13 and KSF2, R. appendiculatus KF10 and R. decoloratus KBF6. Six R. microplus genomes and one genome each for R. annulatus, R. geigyi, R. sanguineus, R. turanicus and H. longicornis from GenBank were included. A partial mtDNA genome of R. appendiculatus (KC503257) and an unverified R. decoloratus genome (KY457525) available on GenBank were used to compare the genome sequences of R. appendiculatus and R. decoloratus. The tree was reconstructed using the General Time Reversible (GTR) (Nei & Kumar [32]) in MEGA X. There was a total of 18,435 positions in the final dataset

