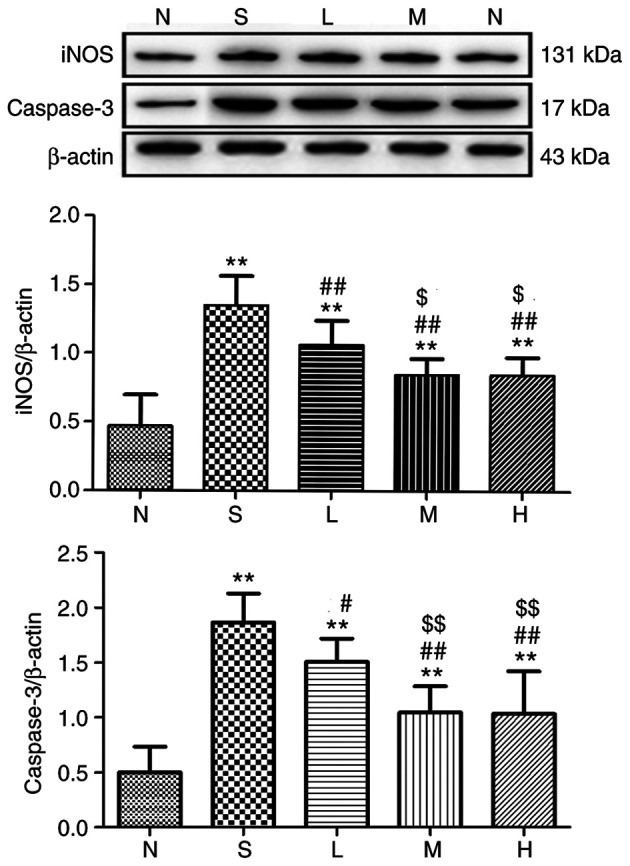
Figure 13.

Relative expression of iNOS and caspase-3 in lung tissue at 24 h. The levels of iNOS and caspase-3 proteins in rat lungs were detected and immunoreactive bands were observed at ~131 and 17 kDa, respectively. The levels of the iNOS and caspase-3 proteins were higher in the saline, low-, middle- and high-dose groups compared with the control group. **P<0.01 vs. control group; #P<0.05, ##P<0.01 vs. saline group; $P<0.05, $$P<0.01 vs. low-dose group. iNOS, inducible nitric oxide synthase; N, control group S, saline group; L, low-dose group; M, middle-dose group; H, high-dose group.
