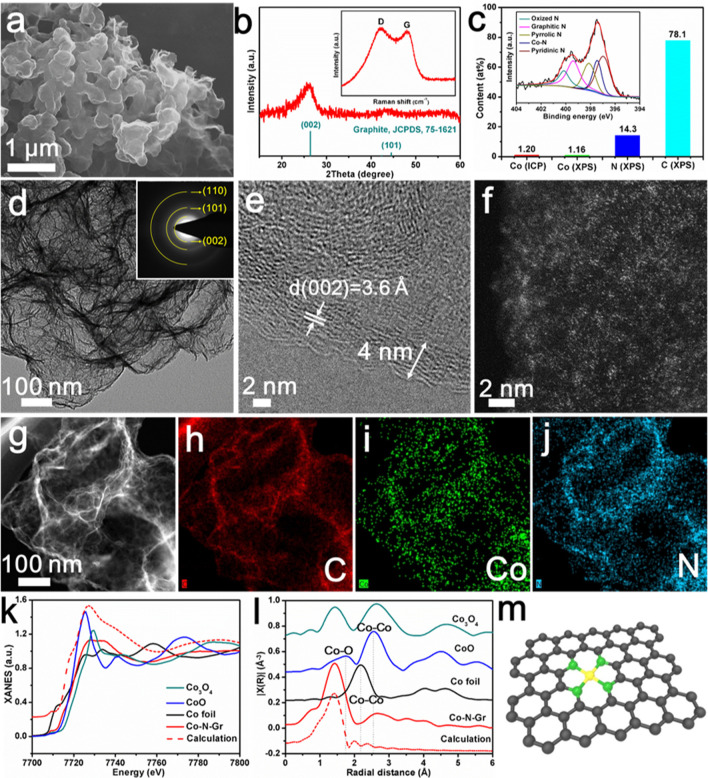
Figure 3.
Structural characterizations of the Co-N-Gr sample. (a) SEM image. (b) XRD pattern and Raman spectrum (inset). (c) Elemental content of Co-N-Gr obtained from XPS and ICP-AES measurements, and high-resolution N 1s XPS spectrum (inset) divided into five Voigt-type line-shaped peaks. (d) TEM image and SAED pattern (inset). (e) HRTEM image. (f) High-solution HAADF-STEM image. (g–j) HAADF-STEM image and the corresponding EDS elemental maps: C (red), Co (green), and N (cyan). Co K-edge XANES spectra (k) and Fourier transform (FT) of the EXAFS (l) of Co-N-Gr, Co, CoO, Co3O4, and calculated Co-N-Gr. (m) Schematic model of Co-N-Gr, including C (black), N (green), and Co (yellow) atoms.

